I don't know yet, but there's an angry bear wait for him below....
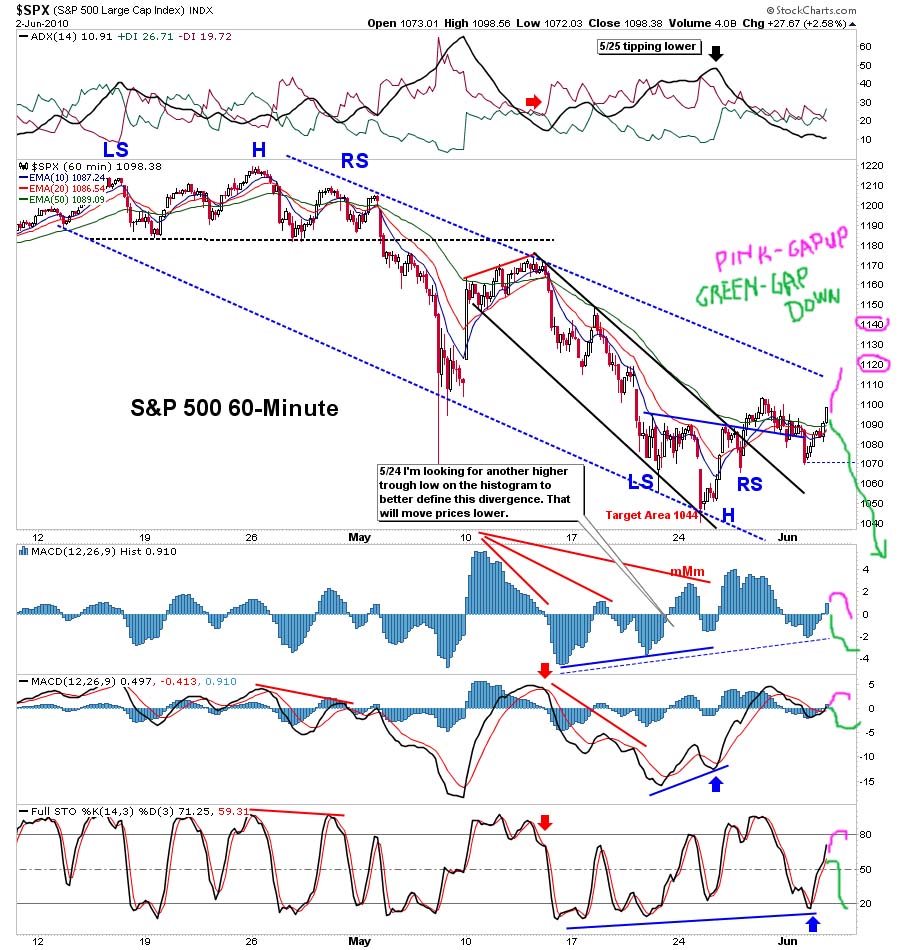
This movement reminds me of the countless grind higher, from the February low. Day by day, the market grind-ed higher, without hardly even a blip of a correction down. We live in a world that has clearly changed tremendously since the March 2009 low.
Computer bots (Skynet) now control the market, and they follow strict rules. Upward and downward sloping trendlines are the key to understanding how they move. Overhead horizontal trendlines are easily broken now, as the light volume allows the bot's to continue pushing up through them, day after day, with NO selling sticking.
These upward and downward sloping trendlines form rising and falling wedges. In a normal market, these rising wedges would break out to the downside, and the falling wedges would breakout to the upside. They would do this at fairly predictable times.
However, with Skynet running the show, the rising wedges don't break to the downside when they come to the apex of the wedge... they gap up, to make the wedge even steeper! The rising wedge that is currently in play now, since the 1040 low, should have broken down several times by now.
But each time the market falls back and touches the trendline, the bot's kick in and push it up more. All at the same time, the "insider's" (aka... Goldman Sachs, JP Morgan, etc...) are all sitting on their hands, and not selling anything, until a certain level is reached.
Sure, they are selling small amounts into each move higher, but they haven't started to dump their core holdings yet, as that won't happen until they get the OK from "The Powers That Be" (TPTB). When is that? I have no clue. We should dump 40 points tomorrow, if there wasn't any Skynet... but we might be lucky to get 10 points.
Unless of course... it's time to press the panic button? But the longer they wait, more angry the bears will be...
Red
P.S. Don't forget to take the time and cast your vote on the Polls I have listed on the blog. Thanks...
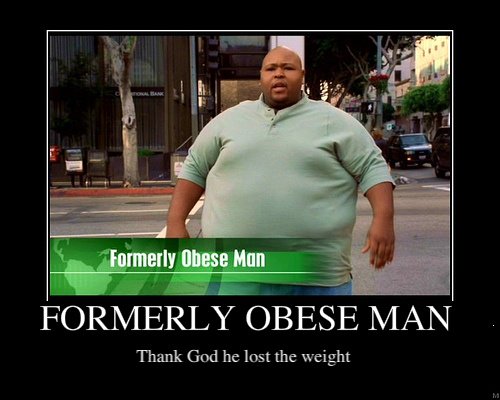
as the market is back to gorging itself again, (but it did lose some weight, right?)
Well it looks like the market is going to fool everyone and actually go up and form the right shoulder around the 1140-1150 area now. At least that what everyone is expecting, so maybe it will actually happen now, who know? That's another way to fool everyone... do as expected, and shock'em!
Maybe they printed up some more money and injected it into the market over the last few days? It came from somewhere, but it still doesn't look like the big boys are buying. So, eventually, the retail traders will run out of steam, and then we will have another leg down.
Not that it will do any good for us bears right now, as there seems to be no doubt that this market isn't going to sell off huge between now and Friday. Maybe a backtest to the 1080 area... if the bears are lucky. But honestly, as long as the volume stays light, I don't see it happening.
So, will next week be the sell off that we have all been looking for? I guess that depends on where we close this week out at. That 1080 area is pretty important to the bulls and bears. A close below it, and I believe we will sell off next week. A close above it, and we will likely go higher next week.
As for tomorrow. I'm clueless? We are so massively overbought right now, that it's not even funny anymore. The market should drop about 20 pounds (points) tomorrow... but again, light volume allows manipulation, and if they want to keep it up... they will.
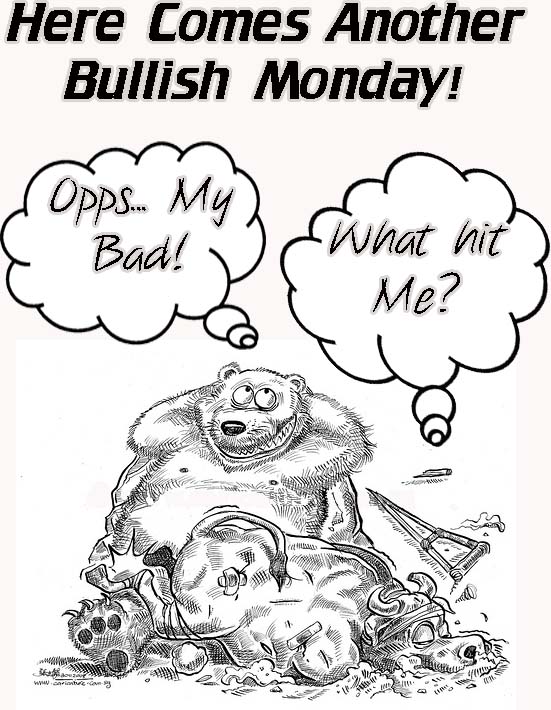
Looks like Monday decided to gap up instead of gap down... but in the end, the day still closed down. Days like these are tough on the bears, as there wasn't any news or volume supporting the move up. Just the typical Bullish Monday history pattern, and maybe just because they wanted to suck in more bulls, and squeeze out more bears.
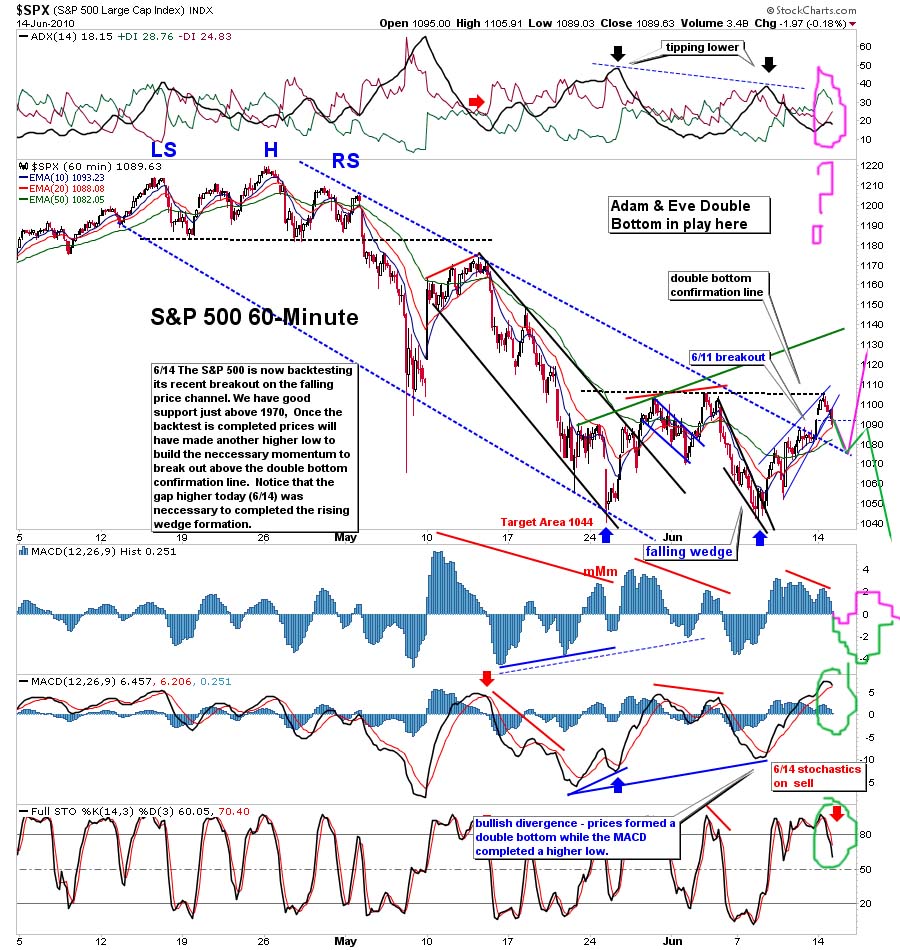
So now what? Well, I certainly don't see tomorrow as an UP day, as I think it's obvious to everyone that the 60 minute chart is massively overbought, and started to roll over into the close today. So, it's not a matter of "if" tomorrow will be a down day, but more about "how much"?
The first support going down will be around 1080, where the upper trendline will be back-tested (from the falling channel that the market just broke out of). From there, we can expect a bounce to occur... but how much?
Will that just be a smaller wave 4 down, with another wave 5 up still to go... pushing on up to 1120-1140? Or will the triple top put in today finish the wave up from the 1042 low, (most label it a wave 4), with a big wave 5 down still to come?
I wish I knew? But I don't. It's really up to the daily chart now. If the daily turns back down tomorrow, then we could see a big wave 5 down... probably to that fake print of 100.72 spy. However, if the daily doesn't roll over tomorrow, then it's likely only a backtest at the 1080 trendline, and will likely go back up for a final smaller wave 5... completing between 1120-1140 spx.
Here's the thing to keep in your mind. Today was up on very light volume, with only about 80 million at 2pm on the SPY. The last 2 hours of the day moved the volume up to 207 million. That means the market still has a lot more sellers then buyers right now.
The market has hit the 1100-1105 area now 5 times since May 28th. Two choices are now in front of the market. It either has now weaken the resistance door enough that the next time it hits it, it will blasted through it to a much higher level (1120-1150?)... or, it's gave up for now as the door is too tough to breakdown at this current time.
Meaning, it will fall back down to a lower low to get more fuel (bears to squeeze) to go back up and test the door again at a later time period. The lack of news out this week leaves me guessing at to which scenario is accurate?
This truly is a "do or die" time for both the bulls and the bears. The line in the sand will be the 1080 backtest tomorrow. Of course I do expect a bounce off the trendline, but that bounce has too go back up and take out the 1100-1105 level, if the bulls want new highs.
For the bears, they want the bounce at the 1080 level to only go slightly back up to sideways, forming a bear flag, which will force the market to fall back into the falling channel again. If the bears can get the market back in the channel, then a wave 5 down will most likely be the path for the market. A new lower low would then happen.
Either way, a news event could spark heavy buying or selling? However, the lack of any news leans in favor of the bears, as they don't need large volume to fall, like the bulls new large volume to rise up and break through the door overhead.
In summary, I expect tomorrow to go down to at least 1080 spx, then bounce. From that point, we could continue down or make another run for the door overhead. The daily chart will give us clues, for if it rolls over tomorrow, then bears will likely control the tape. But if it continues moving higher, then it's likely just a backtest of the trendline, with more upside likely to follow.
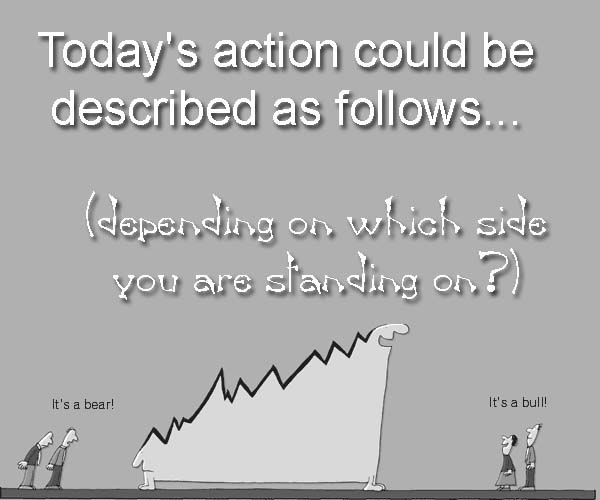
What a short squeeze that was on Thursday and Friday! If that didn't clean out most of the bears, I don't know what will! In fact, the guys over a Mr. TopStep stated... "Today is the largest gap up on any rollover in history."
So what does that mean for next week? I see about an 69% chance of a gap down on Monday, and another down day on Tuesday to follow. If Monday gaps up, it should provide the remaining bears the best spot to go short at. That 1100 area has been hit 4 times in the last couple of weeks, and should still hold the market back on another hit.
The only way I see the market going through that level and holding it, is to consolidate there for several days, and then gap up above on the next day that has some great news to support it. Trying to go up in a rising wedge pattern, and break the resistance, (like what we have now), is extremely difficult.
The odds are very low of sustaining a gap up, while in a rising wedge pattern. There won't be any shorts left to squeeze on a gap up, and the market will likely reverse back down hard. Falling wedges breakout to the upside, and rising wedges breakout to the downside about 69% of the time, according to Thomas Bulkowski's pattern site.
Besides the rising wedge pattern, we also have a perfect looking "MA Pattern", which is a very bearish pattern, with high odds of playing out to the downside.
As you can see from those chart, the big boys aren't buying into this rally... they are selling. The Fed's aren't putting money into the market... they are withdrawing it. The mutual funds aren't getting a huge inflow of new cash either, as you can clearly see by the chart, it's as the lowest level in many years.
Did Friday look to you like a lot of buying was going on by the big boys? It didn't too me. How about Thursdays' ramp job? Did that look like the big boys buying, or just short covering?
How about this article showing that JP Morgan just sold the largest conduit deal in the CMBS market in nearly two years, for $716.3 Million. It's a package that's backed by 36 fixed-rate commercial mortgage loans secured by 96 properties. Hmmm, sounds a lot like selling Real Estate Investment Trusts (REIT's) in 2007... just before they crashed down. I wonder if they took out insurance on them too, just like Goldman Sachs did with AIG? They probably are short commercial real estate right too.
Look at this chart, that shows what the next ticking bomb is... and when it's likely to explode. (Commercial real estate isn't shown in the chart, but it's due to hit about mid-2010 to 2011... I couldn't find that chart, sorry).
Then on Friday, Rip Van Trader caught a large trade of 3.5 Million shares being bought on TZA, the ultra short bear etf for the Russell Index. Either someone is very rich, and doesn't mind losing a bunch of money, or they have some inside information that the market is going down over the next few weeks, not up.
Now, as for fake prints, I'll direct you to this print, showing 2 prints at 1055 ES... which will also fill the gap up on Thursday. Notice how all the previous fake prints were hit within 1-2 days. Will this one be different? I think not. In fact, I think we will fill that gap on Monday or early Tuesday.
Here's another strange print showing 100.72 on the SPY (about 1000 SPX), and it has not been hit in a long time... meaning that it will likely be tagged very soon. I think by Tuesday, but that's just based on my thoughts that it's going to take 2 days (Monday and Tuesday) to get the 60 minute charts extremely oversold.
Then a rally the rest of the week, to close out this triple witching option expiration week at a level that benefits the market makers the most. Where... I don't know?
Red
P.S. If you want to see a bullish case too... go read all the other blogs on the Internet, as many are turning bullish now. I don't disagree with them, as they all have valid reasons for supporting their stance. There are many charts that are turning back up now, especially the daily and weekly. But, I'll let you decide which case makes the most sense too you.
Good luck to all the bulls and bears this week.
P.S.S. Really interest read about Astrology during the next two weeks (click here to read it).
Today was the largest short squeeze ever, as Mr. TopStep quoted on their Twitter feed. I believe it, as I'm so far underwater on my short positions now, I think I can see the oil coming up from the seabed floor now.
I've covered basically my thoughts in the video above, but I want to add some more. The triangle breakout on the market from the top in April is only a slight breakout, and could still be considered "still inside the triangle/channel"... The downward sloping top trendline of the channel (look at 60 minute chart for channel), along with the horizontal support line around the 1040 level, forms a very larger triangle pattern.
It's basically the same upper trendline of the falling channel that is seen clearly on the 60 minute chart, only without the lower sloping trendline of the channel. Just replace it with the horizontal support line around the 1040 area, and you have your large triangle. Hopefully that makes sense too you (as the horizontal line isn't shown in the chart)?
Today the market popped outside the triangle (also the top trendline on the downward sloping falling channel... which is actually the same line). But, I believe it's just a head fake, and it will reverse hard and go back down next week.
The main pattern that is now forming is called a "MA" pattern. These MA patterns, as explained in the video are very bearish, and if it plays out... an 80-100 point move down is too be expected. But, even though I still believe we will sell off hard next week, I have to consider how much open interest there is on the June put options, as next week is opx for June.
So, the possibility of a pattern failure is larger then usual, and that leaves the door open for a gap up on Monday and a continued run up or sideways into Friday. I don't believe that to be the case, but it is possible. They want to take everyones' money, and I just don't know if there are now more bulls or bears left in the market? The open interest says there are more bears, but today's squeeze could have a lot of them switching sides?
Needless to say, I'm disappointed by today's gap up instead of gap down, but it totally worked by faking out everyone out... especially me. Again, I don't expect much for tomorrow but a flat day overall. A move up to the 1093.56 20ema on the daily chart is likely, but I expect it to pull back and close around where it opens... and not break that level.
The best hope the bears can have is for every other blog to now start calling for 1100 or better, to form the right shoulder that appears so obvious now, as the next likely target. First 1100, then 1120, and finally 1150 where all the bulls can exit safely and the bears can board safely. Seems too easy too me, just like crashing this week was too easy. So next week looks like the rally up in opx that will make that right shoulder... which again, seems too easy too me.
(If the video doesn't play, here is a direct link to it on youtube)
I doubt it... but maybe the media will blame something he said in the testimonial today, as the cause of the sell off? Who knows what reason they will come up with? There are plenty of negative things in the news right now... from the oil disaster that's still going on, to the debt crises that is hiding the closet, just waiting for the right time to get out.
Ultimately though, the sell off was all just simple technical analysis... as when the charts are all pointing down, the market can't do anything else but sell off. Tomorrow should be a continuation of today, only without the morning rally part.
Since the continuing claims and initial claims data will be released before the market opens at 8:30 am, I expect that news to be the reason to gap down below the 1040 spx support level. The charts tell me that tomorrow should be a down day, and all that's left to make it happen, is somewhere to direct the blame at.
If not the jobs data, then some other reason that might come out overnight or in the morning... will be the blame. The talking heads on your favorite TV stations have too have something entertaining to blame the sell on, or else they would be out of a job. You don't really think they are going to say that the sell is just based on what the technical indicators are saying, and that NO news event is needed to cause it too happen?
Anyway, I guess we all need entertainment... as technical analysis is a whole lot more boring then the excitement we get from going long on Apple when they beat estimates because of a new gadget... making everyone's life better and your long positions more profitable. Or the anger we feel from the disastrous oil spill that BP did, while profiting from our short positions on them too of course.
Speaking of the oil spill, I found this video on Steveo's blog (http://oahutrading.blogspot.com), and thought it deserved too be re-posted. I never knew that the same oil spill happened back in 1079, or if I did know... I forgot about it. They did the same thing to stop it, as they are doing now. Talk about stupid people... this takes the cake!
As the Bulls and Bears both got whipped around today...
After so many days down in a row, you should expect some sort of "pause" day, and today was exactly that. The market stayed in a loose range swinging up and down all day, until it sprouted some roots and grew a little into the close. But over all, today was simply painful for both sides.
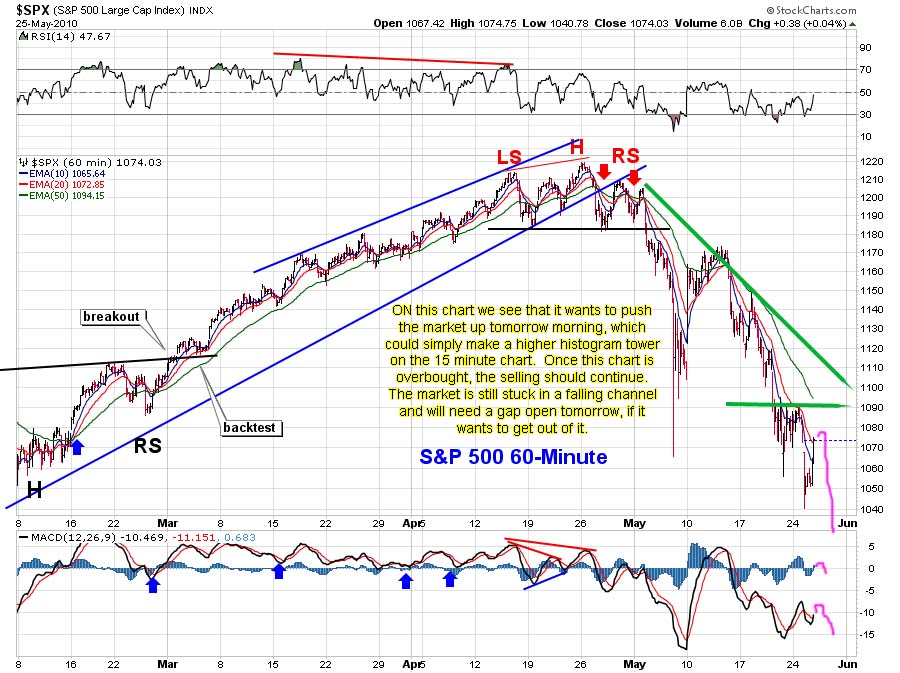
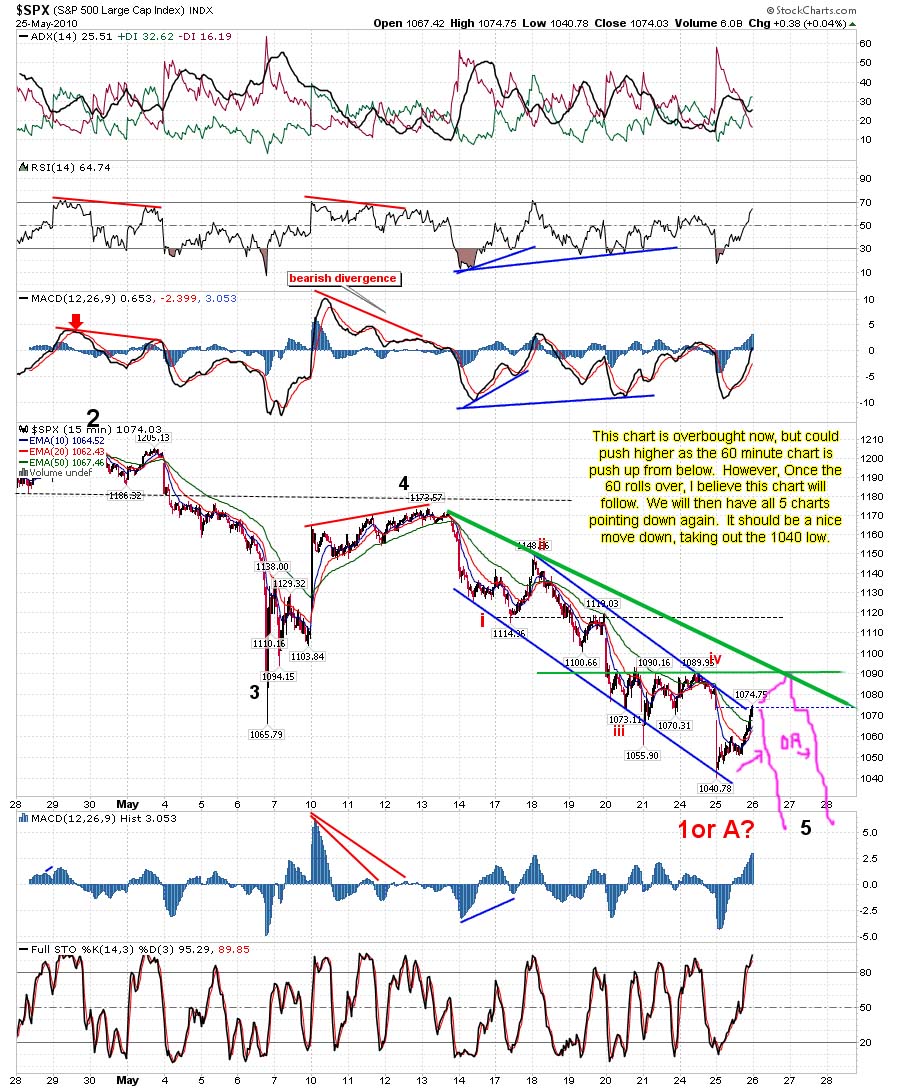
The 60 minutes charts and the 15 minute charts were previously oversold, and now they have worked that all off. The 15 is now overbought, but the 60 still has some room to run higher tomorrow. Whether or not the tape will follow it higher is not known? If it does, then the 1070 area is about the expected high level target I could possibly see, before both charts are overbought again.
Once they become overbought, I expect to see some heavy selling as the daily, weekly, and monthly charts will also be pointing down... making the move down even deeper. It's hard to say how high up the histogram bars will go, before turning over to the downside, but I expect it to be a small tower because of the downward pressure from the daily chart.
When you look at the 60 minute chart, you will notice that while the histogram bars where moving up, the price was trading sideways (except the pop higher at the end of the day). This tells me that the daily chart is still putting pressure on it, and holding the price level down.
It basically means that there are still too many bulls trying to get out, and are waiting to sell at each pop higher. The last pop at the end of the day, means that most of the sellers for the 1055 level are now gone. There will be more sellers waiting at a higher level now, with 1065-1070 being a likely next target.
I don't see the market getting much higher then that yet, at least not until the daily chart turns back up and provides support to the 60 and 15 minute charts. Unfortunately for the bulls, the 60 will be overbought by midday tomorrow, and another leg down should start into the afternoon session.
The daily chart is the key to getting a big rally up started. It's kind of trading sideways to slightly down now, and could easily rollover to the downside and create a big move down... or hook back up and create a 3-5 day rally. But I believe that in order to get the chart to hook back up, there needs to be some good news released to spark it. What would that be, I wonder?
But, today was very bearish all day, with a very small bounce back up in the morning. I really wasn't expecting too much of a rally today, however I thought 1080 was possible. But, the bulls just didn't have anymore money left to buy it seems. They had everything going for them... after all it was "Bullish Monday", the most bullish day of the week. And, they had light volume (129 million shares of the SPY) working for them too, but they failed at every attempt to get something going.
Tomorrow doesn't look an better for them either, as daily chart has clearly rolled back down, with the monthly and weekly also supporting more selling. They also broke through a key horizontal support level on many of the indexes. On top of that, they are still stuck in a falling channel with no real support to stop the sell off, besides the 1040 area... which will likely be broken in the afterhours session, or tomorrow morning.
The lower trendline on the falling channel is now coming in around 990-1000 spx, which should provide some good support, since this falling channel has keep the market in it since the 1220 high. From a technical point of view, the market isn't oversold on the monthly, weekly or daily charts.
The 60 minute charts was trying to rise back up today, from being oversold on Friday, but it turned back down at the end of the day. It can go a lot lower as the ADX line is just now rising up, with the -DI line on top. While it might feel like it's oversold... it's not, at least from reading the technical's it doesn't look like it too me.
The 15 minute chart is heading down, but isn't oversold yet either. It's now in another falling channel of its' own. There are still lots of negative things out there in the world that isn't helping the bulls any at all. Some good news, and oversold conditions are going to be needed to rally this market.
That means we must sell off more, to put the charts in oversold conditions, before any serious rally could occur. Gold was also rallying big today, which tells me that there is still fear in the market. Gold is where people run for safety, when they fear the stock market.
On top of all that, most of the bank stocks sold off today. So did Apple and Google, as well as oil related stocks. Of course with the oil disaster still not solved, I don't see them rallying the market. It probably going to come from some other sector... which one, I don't know?
Bottom line... the traders are still scared to buy. Another lower low is most likely coming, unless some miracle bailout plan is created again. I just don't see that happening again. The Federal Reserve crooks are broke, and they can't steal anymore money from the taxpayers, as the people won't let them.
I'm expecting more selling tomorrow, with small intraday bounces. My target is the lower trendline of the falling channel, coming in now around the 990-1000 level. After that is tagged, I expect a nice rally up to occur, to work off the extreme oversold conditions that will happen from the move down.
Red
P.S. SC, you don't have too read my posts or watch the video's... if you don't agree my "red pill" reports. No point in leaving over spoiled milk... as the old saying goes. I enjoy chatting with you, but if you feel the need to leave, I understand.
P.S.S. Trolls, you might as well get used too me posting stories about you, as I plan to continue exposing the truth. Not that it will be a daily thing, but from time to time, I'll be posting something that still keeps this site classified as a "Red Pill" site. You're welcome to read it of course, but I don't know why you waste your time trying to distract the regular readers here by posting something of no value. They aren't stupid you know... they know a troll when they see one.
It looks like Halliburton was making a power play for the oil, and didn't care about what effects would come from blowing up the rig. Thanks Dick Chenney, George Bush, David Rockefeller and all the other thugs in the Bilderberger group and Illuminati Zionist pigs!
Your days are numbered and good will prevail over your evil plans to destroy the world and save only yourselves. Sorry, but it's not going play out like you portrayed it in the movie "2012". If fact, I believe it will be the end of centuries of lies and manipulation, that you have done to the people of the world.
A new age is coming, and secret technologies are going to be released to the people, rendering your control over humanity inapt. Good and positive changes are going to happen after 2012, not the destruction you want to happen, so you can create anarchy, violence, and chaos.
Moving on... (sorry, I got off subject a little, but these control freaks need to be publicly hung! ... and why can't I find this news being reported by the America press? I have to find it on Russian Television... I wonder why that is?)
Friday was just as I expected it too be... a sell off. Obama lied as usual, by stating that the jobs numbers was great... which rallied the market on Wednesday and Thursday. So who pulled his strings I wonder? Sounds like a typical politician... lie, lie, and lie again. It sure did trap a lot of bulls on that lie. What's next? Will he say they stopped the oil from leaking, but really didn't? I'm sure he would say that... if he thought he could get away with it.
Anyway, from a technical point of view, the market sold off because it hit strong overhead resistance from the 200ma, as well as the 20ma barreling down for above, to form a necktie. On top of the that, the market was bumping its' head on the upper trendline from a strong falling channel that's held the market since it peaked in April. Plus horizontal resistance around 1100 too... so there was a ton of technical reasons for the sell off, but the jobs report was the blame.
For Monday, I'm not sure what to expect, as we are very oversold on the 60 minute chart, but the daily, weekly and monthly are still not oversold. That leads me to believe there will be more selling next week. If the market stays in this falling channel, as I believe it will, then we could easily go down to 1000 spx or so.
My thoughts for Monday are that we gap down at the open, but quickly bounce back up throughout the rest of the day. It should take most of the day to work off the oversold conditions on the 60 minute chart. While the histogram bars are rising back up, the price could rise back up too, or just trade sideways until the chart is overbought again? Just because the chart is oversold, doesn't mean the market will rise back up in price while the STO's, MACD and Histogram indicators do.
It could, and should... but there isn't any guarantee that it rise up with while it works off the oversold conditions. However, if it does rise up, then the 1080-1090 area is the likely bounce target. I do not see the market breaking outside the falling channel yet. Not when the daily chart has worked off its' oversold conditions and just turned back down again.
So yes, this market is due a powerful rally, but until we put in a lower low, I just don't see it happening. I believe a powerful rally will come after we have a capitulation day like February the 5th was. We haven't had one yet. There are still a lot of bulls out there thinking that we are just trading sideways building a base to go higher. The bulls have too be forced into panicking... which I haven't seen yet.
Back to Monday... if we gap down, then I expect it to reverse early in the morning an rally throughout the rest of the day to work off the oversold conditions on the 60 minute chart. If we gap up, I think it will be sold hard as there are retail bulls still trying to get out, and bears trying to get in. That's why I don't think we will gap up. It seems too easy, as it would allow the bulls an escape and the bears a great entry point.
Of course a flat open is possible too, which should lead to some early selling from panicked retail bulls, and then a rally the rest of the day... to again, work off the oversold condition on the 60 minute chart. The day could simply be a "pause" day, which means it could close flat making a doji. This all assumes that there isn't anymore bad news released over the weekend. If so, then the selling could continue with very small bounces back up.
Personally, I would love to see it gap down in morning (at which point I would close my shorts), and then rally back to 1080-1090 area, so I could get short again. But, that seems to easy... which leads me to believe it might not happen? The only thing I'm feeling the strongest about, is that the market is highly likely to stay in the channel and put in another lower low by the end of the week. The target looks to be around 1000 spx, but that's just guessing at where the lower trendline support will be at next week.
So, if Monday doesn't just continuing selling all day, and actually give us a decent bounce, then Tuesday should be the next big move down. If last Friday was a smaller wave 1 down, and Monday gives us wave 2 up, then Tuesday would be a wave 3 down. But again, I'm not an Elliottwave expert. This is just speculation at this point.
There are other counts that have us breaking out the channel and going back up to 1140-1150 to put in a right shoulder. It could happen like that, but I don't believe it will... until it first puts in a lower low. The downward pressure from the monthly and weekly charts is huge, and now that the daily has also turned back down, it tells me the market is still too weak to go make that right shoulder that everyone is looking for. Maybe after the lower low... or maybe never?
To recap... I'm expecting a doji Monday (assuming no more negative news), and large down day on Tuesday, and then a rally into the end of the week. To what level, I don't know yet? It will depend on how far we sell off, as the rally back should be some type of Fibonacci level. We'll cross that bridge when will get there...
Red
P.S. While the world is focused on the oil disaster, our evil enemy Goldman Sachs is once again laughing all the way too the bank. In part 2 of the video below, they talk about an email that a Goldman Sachs employee emailed to his girlfriend, telling her that the company was going to take a large short position against the Gulf Oil Rigs just one day before the disaster happened.
For those that forgot, Goldman Sachs also had large short positions on the mortgage packages they were selling during the 2007 mortgage bubble peak. And, they also took a large short position just days before 911 occurred too. They profit from being part of creating disasters that kill people. If that doesn't make you anger, I don't know what will? These people need to be tortured by the public at large, for crimes against humanity.
And finally, this professor mentions that some unknown person posted something on a website stating that a North Korean submarine was responsible for the disaster. But, he thinks it's very unlikely to be true, as the creditability of the that story is weak. He focuses more on the fact that Halliburton people were on the rig just 20 hours prior to the explosion... leaning more toward their involvement.
Regardless of which story is true, if either is true? ...the one thing that is obviously a fact --- It was all planned ahead of time. How else could Goldman Sachs have known when to short them? Just like 911 was planned, and every war and major event this country has had in the last 100 years or more. Wake up people! Everything is planned, controlled, and staged to make a profit and control the brainwashed public.
If there is one video you should watch (later as it's a long one), it's this one by David Wilcox called "The 2012 Enigma".
It will open your eye's to a lot of things that "The Powers That Be" don't want YOU to know! (P.S. It's about something positive and wonderful for once... LOL)
No Post For Friday Again Gang. I'll have the weekend post up by late Sunday Night, and I'll do a video again as well. Great Day to be a Bear, and I hope you Bulls survived it and got out OK. Go Enjoy The Weekend.
A doji means indecision...
Basically, we are waiting on the job's report tomorrow. We could rally higher if they are really, really great numbers. However, I believe the numbers are already factored into the market. I think the resistance we hit above at the 200ma, will hold the market back, and another leg down will start.
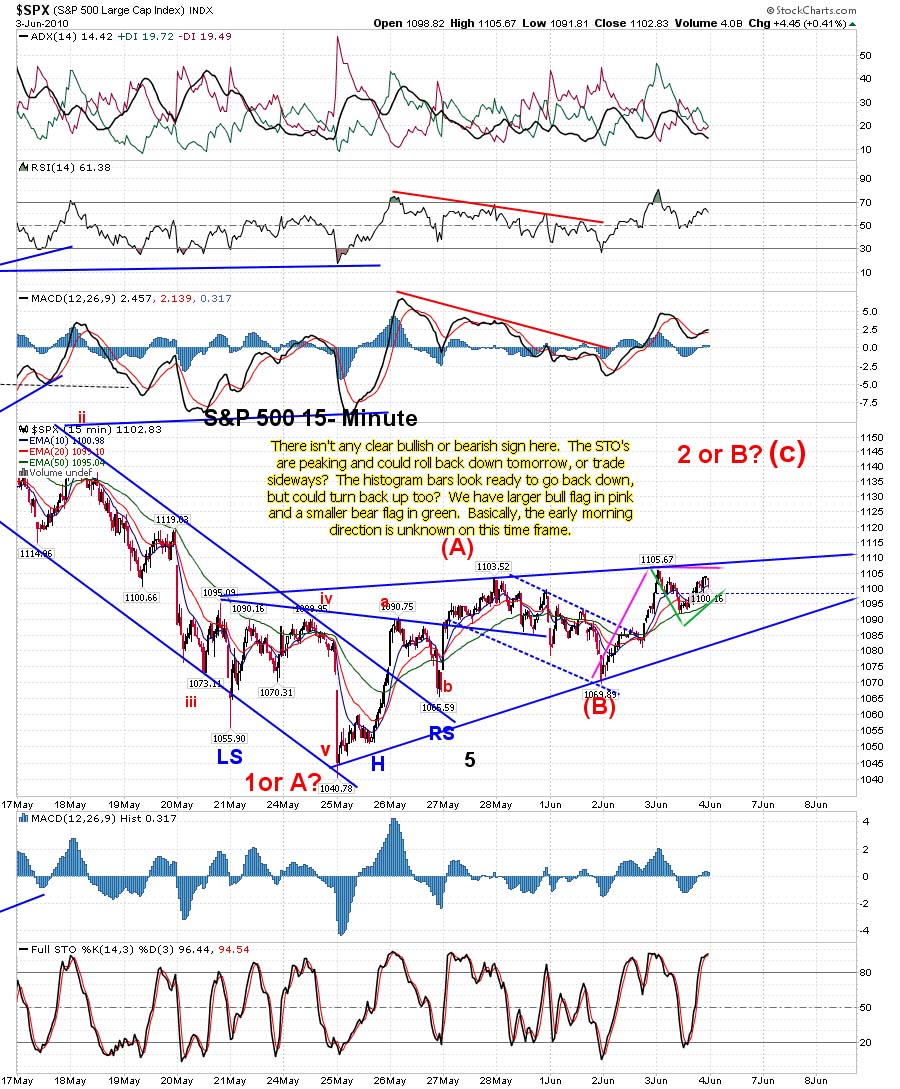
But, I'll present both sides here, as there are as many bulls reading this post as there are bears, but make no mistake about it... I'm still very bearish. On the 15 minute chart we can see that there seems to be no clear reading either way? The move up from 1069 to 1105, and then back to 1100 could be a large bull flag, while the move from 1105 down to about 1092, and back up to 1100 area, could be a small bear flag. It could go either way tomorrow?
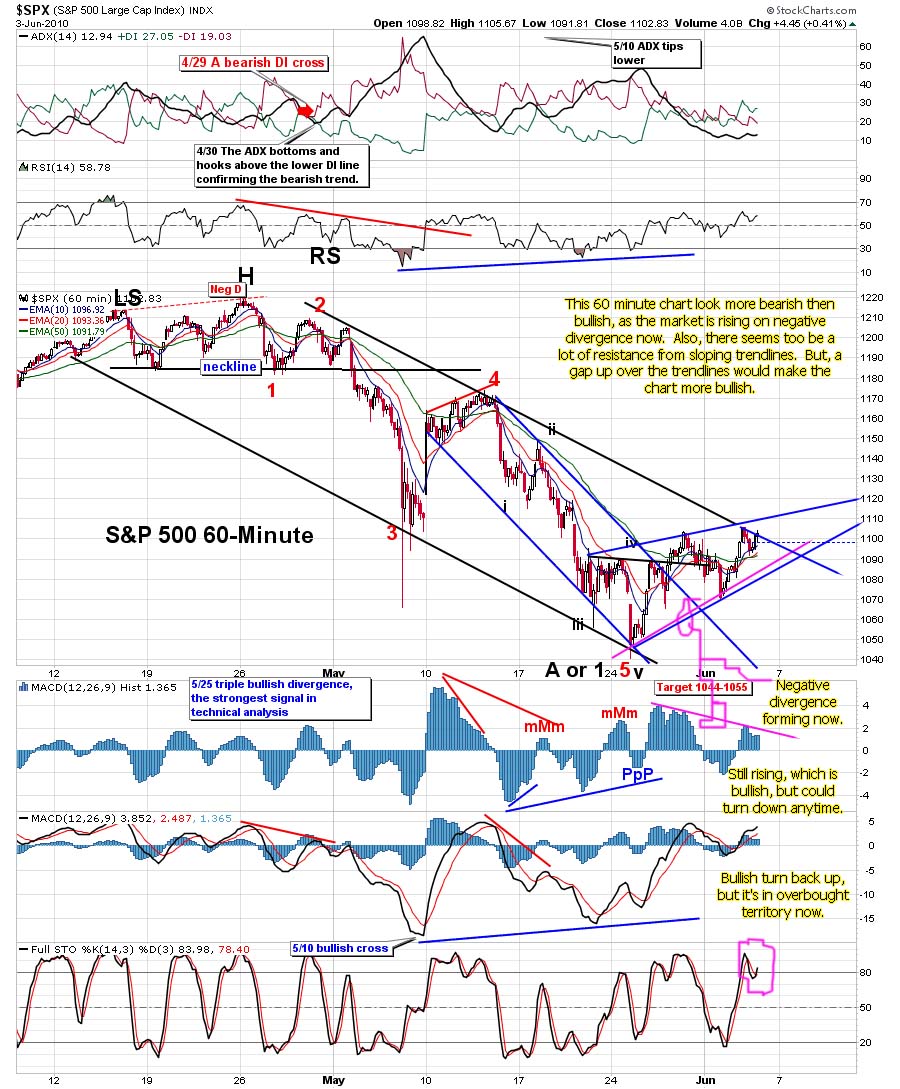
The 60 minute chart looks like it's running out of room in the downward sloping channel, but could go up a little bit more before rolling back down. The histogram bars are overbought now, but could still go higher. The STO's have turned back up, but are already at a high level above 80, which means they don't have much room left before they roll back down.
The fact that the volume was very low today, and they didn't push the market higher then the 1106 area that Mr. TopStep mentioned, tells me that they don't want to go higher. Believe me, if the big institutions wanted to take out last Thursdays' high, when we were at 1105 today, they could have done it very easily. This was all retail buyers pushing the market up today. The big boys were just sitting on their hands waiting.
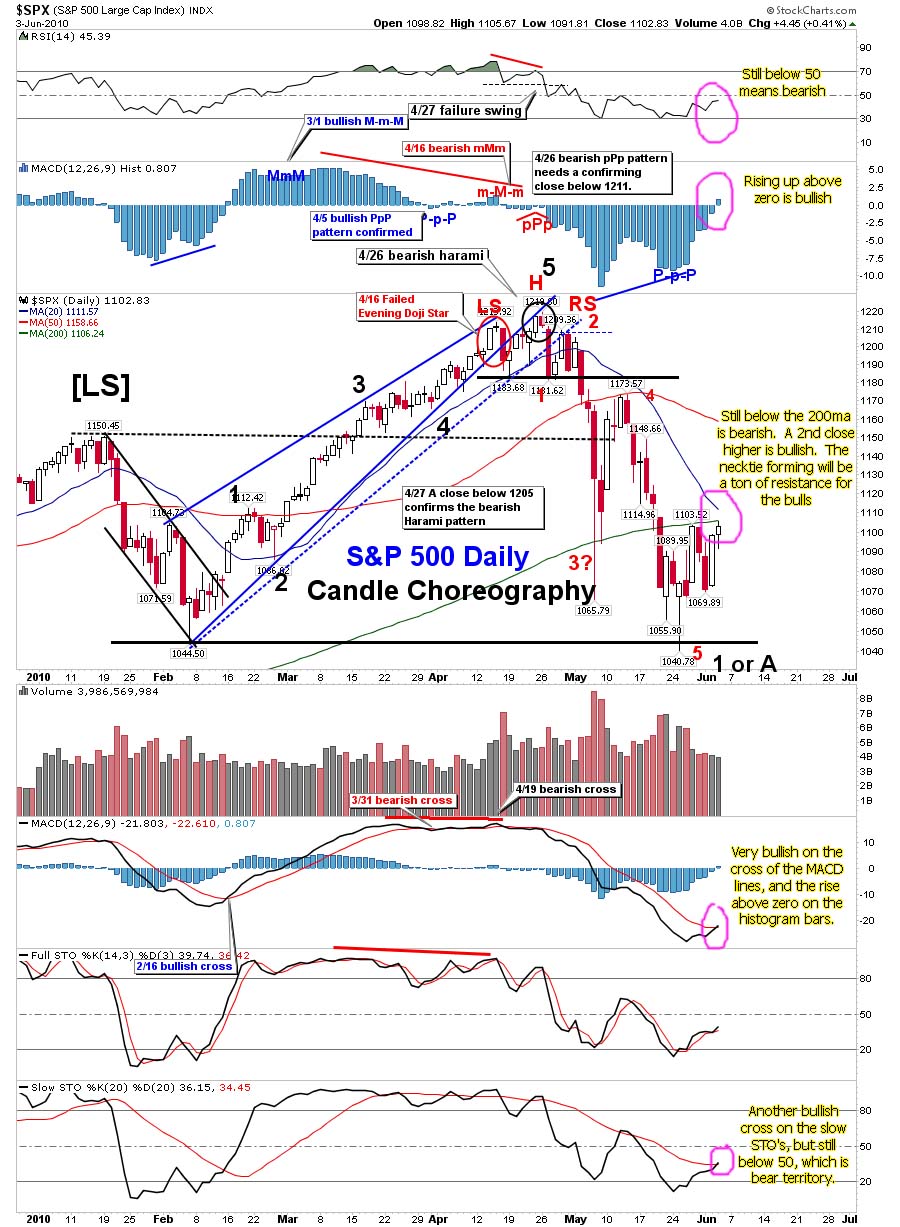
Intentionally holding this market under the high from last Thursday is a key sign that they don't want to go higher yet. They tagged the 200ma on the DOW daily chart and backed off too. The 20ma is barreling down fast toward the 200ma, and will form a powerful necktie of resistance tomorrow, when I expect it to hit it.
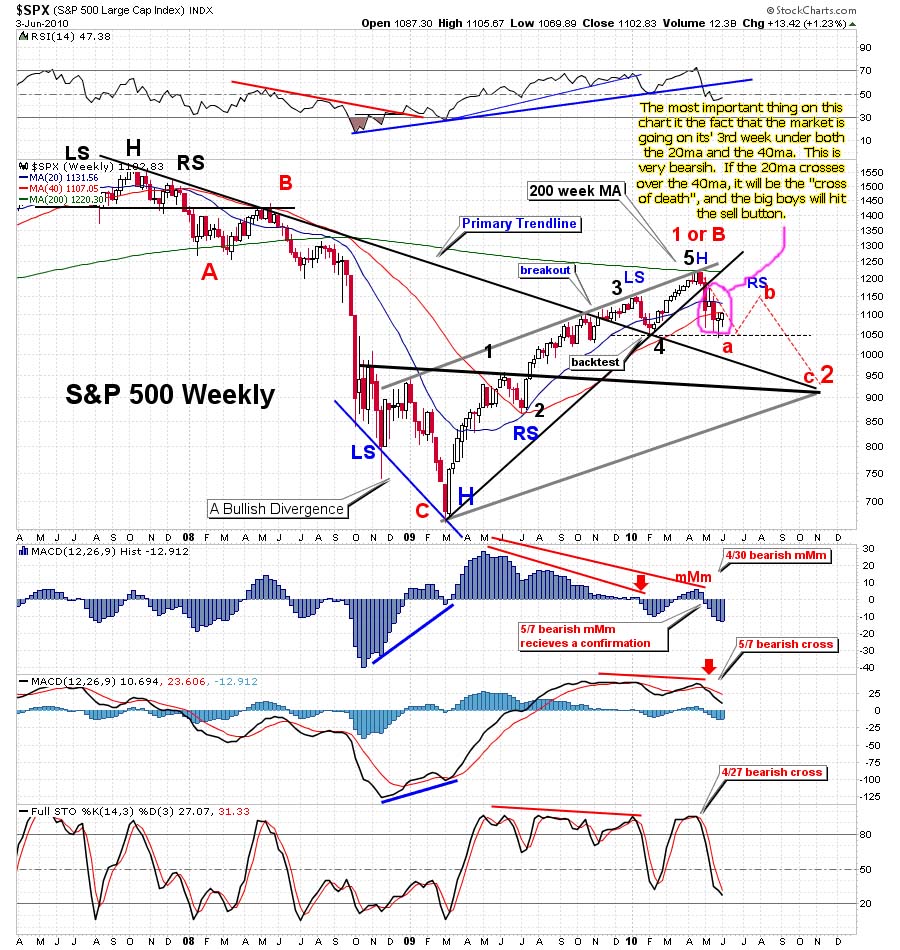
On the bullish side, the daily chart is now above the zero line with the MACD lines now touching and ready to cross over and push the market higher. But, the larger weekly chart is forming a bear flag now, if the market closes out flat this week, then next week should produce a large drop on that time frame. Remember the weekly has now spent the last 2 weeks under the 40ma at 1107.05 spx, this week could be the 3rd time under it. It hasn't been under the 40ma since the March 2009 lows. If the 20ma crosses over the 40ma... you can kiss the market goodbye, as the Bears will be eating steak for dinner.
Everyone and their brother seems to be waiting for 1120 spx from the falling channel or 1140-1150 for the right shoulder to form. Do you really think they will just let all the bulls cash in their longs at those levels, and allow the bears to get short? I don't think so. If you listen to what Mr. TopStep said... he stated that the shorts have been basically squeezed out these last 9 days. Without shorts to keep the market up, and without the big institutions buying... who's going to push it up through all the overhead resistance to make that right shoulder? The retail trader? Please.... you know better then that!
This market is heading down again... if not tomorrow, then next week will be another large down week. Rallying when you are above the 20ma and 40ma on the weekly chart is easy, as they provide the support needed to bounce off from, but rallying when you are under them is another story. This market isn't done selling yet... I wouldn't be buying into the bulls' propaganda if I were any of you reading this.
There is more bad news hiding in the closet right now, it's beating on the door to get out. Just when every bear has bailed out, and every bull is on the long train... the door will open, and train tracks will be gone as the next bridge is suddenly blown up... courtesy of Clint Eastwood and Sister Sara.
The bears are waiting patiently at the bottom of the bridge now, as the train is speeding up to its' finally destination. Last stop for the bulls to get off was today, as tomorrow they might have too jump off the train before it reaches the bridge...
The rally up today was one big short squeeze on no news. However when Obama leaked out that the Friday job's report is really going to be good, the market rallied. Great timing Obama. I wonder if they have ever released good news when the market is topped? Or how about releasing bad news when the market has bottomed?
No, of course not... they play the game of tricking both bulls and bears, by carefully releasing news at pre-planned time points. Today they wanted to rally the market, and that's exactly what they did. All the retail buyers went long today, and more will jump on board tomorrow too.
We could now go up to the downward sloping trendline at 1120 spx, into Friday's wonderful jobs' data. Wonder how good it's going to be? I'm excited, as I need a job... especially since my current job is about gone now. I want too sign up to be a census worker too. I know they must be high paying jobs... after all, the last statistic I heard was that it cost $150,000 for every new job created. It's got too pay well... right?
But who needs a job anyway? I'll just go long when the wonderful jobs data is released, as I'm sure that will cause a huge rally up to new highs... right? Just paint "I'm a sucker" on my forehead, and I'll even borrow money from my mortgage and credit cards to invest in this new bull market.
Ok, so enough ranting and raving...
Here's the chart of the spx on the 60 minute time frame. As you can see, we are still heading up on the MACD's and the histogram bars are rising into positive territory now. It could continue higher or roll back down. If it continues higher, then you can expect 1120 spx to be the first target, and then possibly 1140 spx. If it rolls back down, the market should fall hard and fast, into a wave 3 of 3.
So at this point, it's up to them as to what they want to do? Do they want to rally for the rest of the week and into next week, and then take the market down. Or, do they want to take the market down starting tomorrow? Either way, the market is still in a confirmed downtrend, and will likely continue lower for at least this month, if not the next month or two?
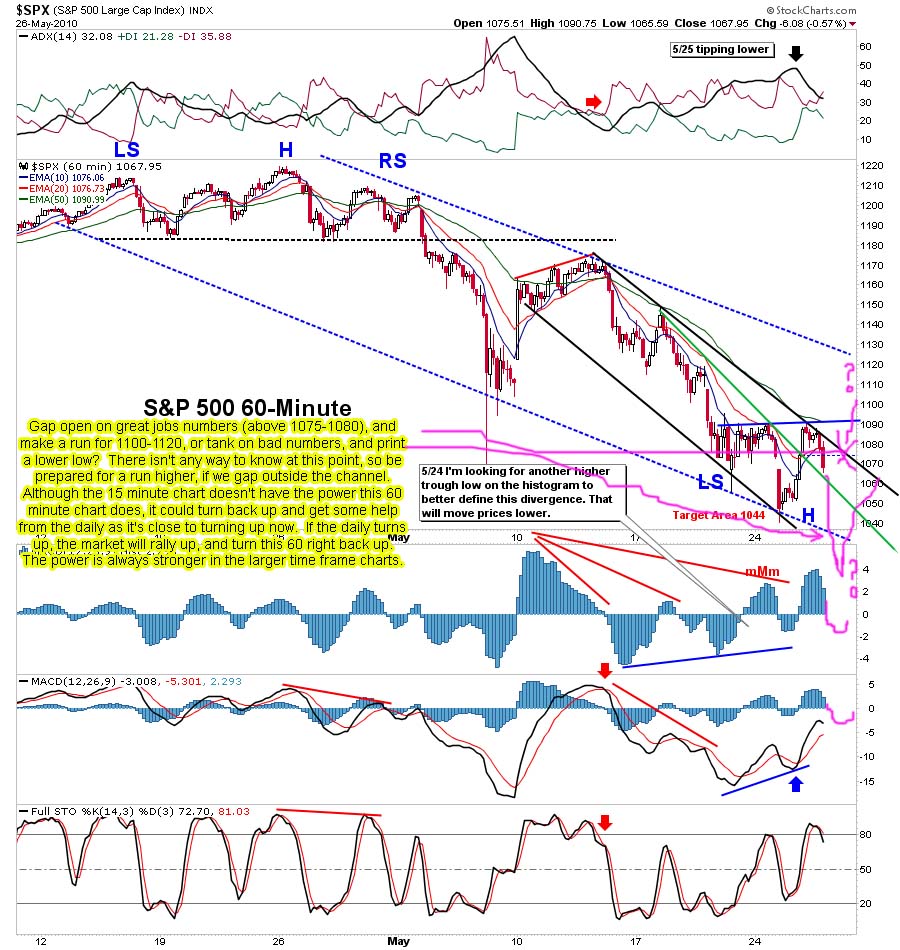
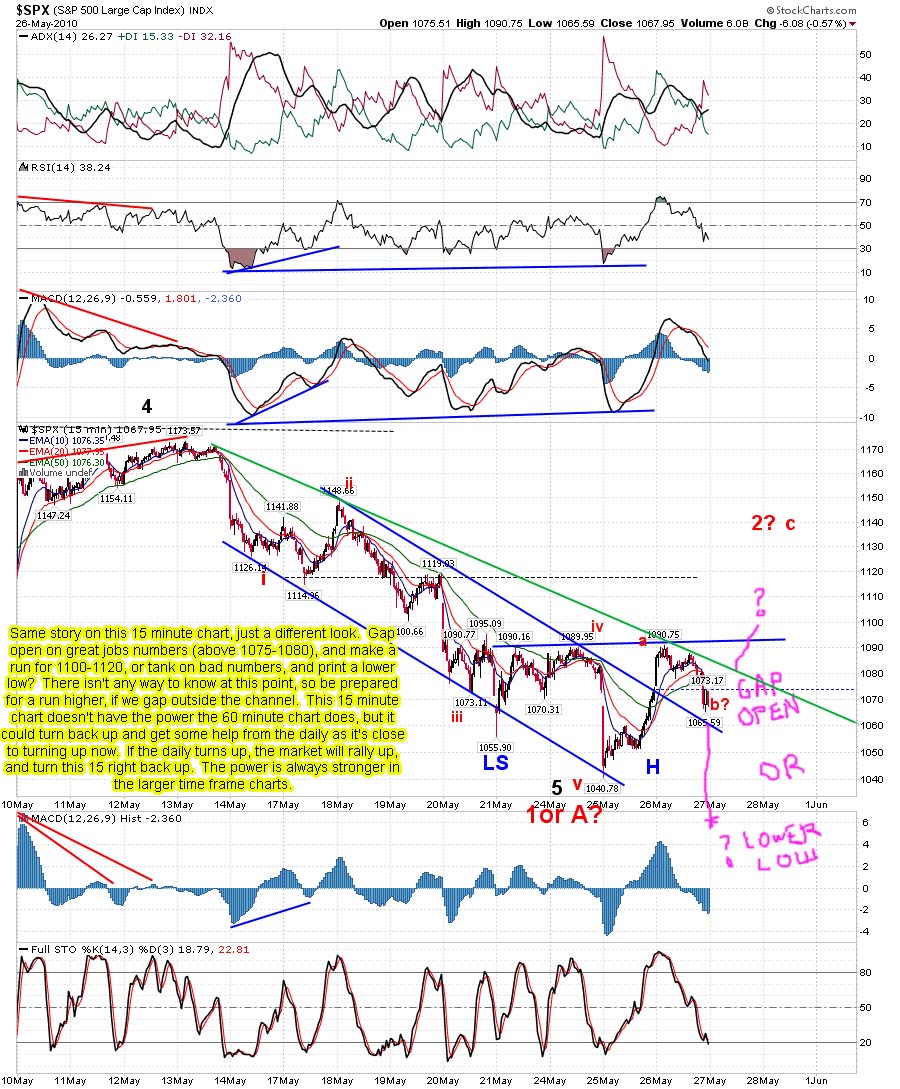
Pretty simple then... a gap up and we go higher to 1120 - 1140, or a gap down and we start the next leg down in the bear market.
The wild swings today felt like riding a rollercoaster ride...
Today was a great day to be a day trader, but swing traders were probably sweating bullets. I remained calm and didn't close out my short position until the end of the day. It's hard to say what tomorrow will bring, but more selling is coming, before we have a large rally back up.
The charts are telling me that we could actually gap down again tomorrow, as both the 60 minute and 15 minute charts are now pointing down. However, I do believe there will be a short bounce in the morning, as dip buyers and day traders speculate on big move back up.
Will it happen? I doubt it... but a bounce of some degree is still likely. The close was at a double bottom from the afterhours low put in Monday night. That's another reason I expect a small bounce. Light volume throughout the day is also another reason to expect a bounce in the morning.
But, make not mistake about it... this market is very bearish right now, and I do expect more selling tomorrow and Thursday. I think the next 2 days could but in a lower low, with some panic selling once we break the double bottom area around 104 spy.
So, not a long post today. If you are short, I'd stay short, unless you are trying to swing/day trade a little like myself. I only did so because I didn't like the position I was in. I plan to get a better position tomorrow. Again, the market is very bearish right now, and bounces can be shorted... until we put in a lower low. Then I expect a nice rally up for a week or so. After that... well that's for another post.
The market closed the month of May out, as the worst it's seen in 70 years. Does that mean June is going to be just as bad? I doubt it, as I do expect a rebound to happen this month. From what level is the question? Is the current 1040 spx low the starting point, or do we still need another low first... before starting a serious rally?
In these video's, I'm going to explore both bullish and bearish counts, as both are possible at this point. From a technical point of view, the market is looking very bullish right now. The daily chart is starting to turn back up, the vix is overheated, and the dollar is looking like it needs to pullback some and give the euro a nice bounce.
But, we all know that looking only at the technical picture will get you burnt sometimes. You must also include other things, like the news for one. Markets can stay overbought or oversold for longer then you might expect them too. I'm going to cover the news factor too, as I think that will be a big mover of the market next week.
One thing to keep your eye on is the announcement that France is now warning on their credit rating. That, plus the ongoing oil disaster, in which the latest attempt to fix the problem failed over the weekend. There are still many things that can spook the market, causing another sell off to happen.
So yes, the technicals are pointing for a relief rally, but since everyone and their brother is now expecting the same thing... what's the likelihood that it's going to happen like that? Most chartists now have us going back up to either 1120 or 1140 on the spx, and then another wave down.
That's the part that makes me wonder if it's going to happen like that? The market usually doesn't allow the bulls and bears to profit, by entering and exiting their long and short positions at per-forecasted targets. It fact, it usually likes to trick them both, by trapping one in their position, and not allowing the other one a spot to get a position.
Regardless of whether you are bullish or bearish, both are usually taken to the cleaners in this wild casino game they call the stock market. I know that most bears were squeezed out on last weeks' 300 point up day. The bulls didn't see that coming either, and probably missed the ride up too. But, I think bulls are on board now, as they all see the Inverse Head and Shoulders pattern that should produce a nice 50 point up move, to about 1140 spx, should it play out?
The bears see the pattern too, and are probably sitting on the sidelines in cash... too afraid to short from the 1090 area that we are currently at. They are waiting to go short at 1140, at the same point the bulls will close out their longs. Seems a little too easy for me to believe that the market is going allow the bulls and bears to profit by a move up to 1140, or even 1120 spx, as others have as an upside target.
If I were the market maker, I'd gap it down on Tuesday, trap all the bulls, and keep going lower until I put in another lower low... not allowing the bears a good spot to get short on, or the bulls a bounce to get out on. But, I'm not the market maker, so I don't know what will happen on Tuesday?
I will say this... if the market really does want to go up to the 1120 or 1140 area first, it needs to gap up on Tuesday to get above the current resistance levels that are currently holding it back. It could very well do that, unless some worst then expect news comes out before Tuesday.
Most of the week doesn't have any really important data or earnings, until Friday's jobs data. That should be a market mover, but which way... up or down? If I am to think like most retail traders right now, I'd suspect that most people will think that the data will be bad and cause more selling.
But, we all know by now that the government always lies on the data anyway. So, a better then expected number could rally the market instead of causing it to sell off. I suspect that the market will be going down into the Friday data, and will turn back up and rally on the news... which would trap a lot of bears, should the market be dumping hard into that date.
This is all just guessing of course, but again... just think what is it that most people are expecting next week? Most are looking for a positive, bullish week. A gap down on Tuesday, and continued selling into the end of the week, would put a bearish taste in everyone's month. The bulls would become bears, and they would all be expecting an even bigger sell off on the jobs data.
Of course the opposite is also true, if we rally into Friday. At that point, I'd expect bad numbers and the market to sell off, after reaching the forecasted 1140 or 1120 area that everyone is now expecting. But again... how often does the market do what everyone expects? Just food for thought... for all you bullish folks out there.
Red
P.S. Here's a interesting audio from Larry Pesavento. Just click on his name to go to the website, or listen to just the audio right below.
No Post For Friday Gang. I'll have the weekend post up by late Sunday Night, and I'll do a video too. Go Enjoy The Weekend.
How many bears got wiped out today?
The market rallied up today on NO news at all. However, all the technicals did point for a possible breakout, but I sure didn't think it would be so large. That means tomorrow will most likely be just a pause day, with little movement in either direction. I'd lean more toward a small pullback, as we hit the 200ma on the spx and dow. The market rarely pushes through on the first hit of a major trendline.
I believe the target area that the market is trying to go to, is the 1120 spx, and even possibly the 1140 spx. Will it get there? It's hard to say for sure. There are lots of road blocks along the way, that could stop it dead in it's tracks. The 1120 area is the gap fill area from May the 20th, and the 1140 area is just under the left shoulder from early January of this year.
So for tomorrow... it's anyone's guess. Since it's a Friday, and we are going into a 3 day holiday weekend, I don't expect much volume to be traded. That will of course favor the upside. But, that doesn't mean the market will have enough energy to pierce through all the overhead resistance. That's why I'm just expecting a flat or "pause" day, with not too much action on the up or downside.
This move up today was probably a "C" wave, or a "3"? I'm not a Elliottwave expert of course, but just about any trader would probably agree with me on this call. So tomorrow is the day to lock in your positions for next week... depending on whether you are bullish, bearish, or just plan on sitting in cash to be safe.
Today played out as expected, from Tuesday's post. The market ran up to 1090 spx, and hit a brick wall. It gaped up to get out the falling channel on the 15 minute, but couldn't get out the falling channel on the 60 minute chart. In order for the bulls to get out of that channel, I believe they must gap up above 1080 or so.
The bears will want to hold them in the channel of course. If they are able to, it will likely put in a new low on the spx, and hopefully put in a double bottom, or lower low on the qqqq's too. Based on the charts, the 60 is looking like it wants to push the market down in the morning, and the 15 is already oversold, and will likely turn back up when the 60 minute does.
The news out tomorrow on the job data could gap it up out of the channel, or cause it to sell off early on. Of course I'm short, and I'm wanting it to tank, but the market doesn't always do what I want it too do. The morning session will tell us the direction, and the 8:30 am jobs numbers will be the blame either way the market goes.
Red
P.S. This is a link to someone who seems to be well connected on the world events. Some people think he is crazy, and I'm certainly not going to agree with everything he claims... but the part about the Federal Reserve gangsters blowing up the oil rig certain got my attention. (By the way, the good guys in all these posts are the "Black Dragon Society", and the bad guys are the "Federal Reserve Board Nazi's").
So yes, some of those posts might be garbage, but if there is one thing I believe too be true, it's that certain forces inside our government are real, and are truly evil. They are part of the "New World Order", which includes about all the recent presidents of the past many decades.
However, I believe their rein of power will end soon. There are good guys fighting to protect us all too. I believe Ron Paul is one of those good guys, as he's still fighting to get the Fed's book's audited. The collapse of the Fed is coming, and those gangsters will slowly be arrested one by one. We are all part of something wonderful that's happening right now. Change is coming... and for the betterment of all the people of the world. I believe 2012 will bring on a positive change for all of humanity, and an end to the enslavement the Illuminati have keep us in for the last few centuries.
Ok, there's my "darkside" post. Now call me crazy, if you want too. It doesn't matter to me. I'm simply put out the news... it's up too you to believe it, or not?
On Monday, at the close, the 15 minute and 60 minute charts aligned up together pointing down. That caused the massive sell off into the close and afterhours session. Tuesday opened up with a gap down to 1040 spx, and struggle to get back higher early on.
But in the afternoon the 15 minute and 60 minute chart aligned up together once again... but this time pointing up. This caused the short squeeze into the close, and higher afterhours numbers. Many bulls went long here and will probably have a chance to get out in the morning tomorrow, as the 60 minute chart is still pointing up.
But, the 15 is now overbought and will roll back down when the 60 is peaked. I expect that to happen in the first few hours of the day. Once it rolls, the 15 minute chart will follow. Then once again all 5 time frames will be pointing down again. I expect the 1040 low to be taken out on this next move down.
Nothing has really changed to make me be bullish on the market. The Monthly, Weekly, and Daily charts are still going down, and will push this market down hard when the 60 and 15 re-align back down. The market is still stuck in a downward sloping channel, and it will have to gap up out of it tomorrow to gain more traction to the upside.
If it's able to gap out of the channel, it will find another wall of resistance from a different downward sloping trendline around 1100 spx, and that's assuming it's able to go through the horizontal resistance line at 1090 spx. Since the 60 minute chart is more powerful then the 15 minute, it's possible that a run for 1090 could happen. But first it must gap out of the channel it's currently in.
I just don't see that happening tomorrow. I see a flat open, and some chopping sideways action until the 60 minute chart gets overbought. Then I see another move down coming. I now see the writing on the wall, and for those with a keen eye, they also shall see.
So, I wish all you bulls a bears the best success possible.
Red
P.S. Someone asked me if the fake prints work and how accurate they are. Monday night I caught one, but didn't think it would play out today, as it was too high from the gap down that occurred. So I went short close to the open, instead of waiting, and getting a much better entry on the rally back up. That's the emotional part that I'm still working on, as learning to trust what I see in the charts is the hardest part. It clearly showed me that it was oversold, and should rally up some... and of course the print told me the target, but I didn't listen.
The market looked extremely weak all day today, as the 60 minute chart pushed hard to work off some oversold conditions. Unfortunately, the 15 minute chart didn't help much as it was already in overbought territory, which meant that the 60 was trying to swim upstream against the monthly, weekly, and daily charts that were pushing it back down.
Tomorrow morning we have consumer confidence data and FHFA housing price index out at 10 am. Not much else to move the market, as there isn't any earnings announcement on any company that can move the market. Too me, it's a little frustrating as I could have gotten back in short at the high this morning, but I was expecting Tuesday to put in the high for the week.
It still might happen, but a gap up needs to occur in the morning. The downward sloping trendline has held the market tight in a falling channel for several days now. If the market can gap open tomorrow, and run higher, the next major trendline of resistance (from another falling channel) is around 1100 spx. What a wonderful place to go short... if the market would be so kind.
We could continue falling, without stopping until we hit 988 spx area, which is the 20 MA on the Monthly chart. I do believe that will stop the falling, but I won't be going long there. I will exit most of the shorts I will hopefully purchase tomorrow, but I'd rather stay in cash and not get killed by the falling VIX on the ride back up.
So for tomorrow, it's pretty simple... a gap up should produce a nice run up to at most 1100 spx. A flat or down open will keep the market inside the falling channel and the selling will continue.
Best of luck to everyone...
Red
P.S. As was surfing around a little bit, I went over to "Follow the Money" (link on Red Pill sites on my blogroll), and started watching a video about a earthquake watch until the 27th, and it started to bore me as it was getting too technical. But at the very end his stated the possible places for the earthquake... the lower tip of South America.................... and Baja, CA!
You want an excuse to blame the coming crash on... how about an earthquake? God have mercy on those people if it does happen. I pray it doesn't, but with or without the earthquake... the technicals say the market it about to puke!
In this weekend update, I decided to put up some video's showing you where I think we are going next week. (Be sure to enlarge the video picture to see everything). I studied many different charts from several different Technical Analysis experts. All of them are listed on the blogroll, and I encourage everyone to check out their charts.
I'm simply trying to summarize what I see from looking at their charts, and present it too you in a video format. Of course I'm going to agree with some of their forecast and disagree with others. It's up to you to figure out if it makes sense to you.
So let's look at one of my favorite chartists, Ron Walker of The Chart Pattern Trader. He is quite good, and does daily video's that you all should watch. I learned a lot about TA's from his video's, and you can too. I've learned most of what I now know from other people's sites. I guess that why people put their stuff on the internet... to help teach others. Anyway, let's look at what I see from his charts...
So, to summarize again what I'm expecting for next week. I expect to fill the gap around the 1115 spx on Monday or Tuesday. That's about 112 spy, and it lines up perfectly with this fake print. Notice that the date is May 20th, and it is "Real Time". Also notice the large spike in the chart, which had 2,040,896 as the volume (you can't see it now). It was in the afterhours session of the 20th, and the market was never there during regular hours.
Is this our upside target for Monday or Tuesday? Could be? Remember, some of these prints could be just late fills from earlier in the day. We did trade there on the 19th... but not on the 20th. So, just keep that target in mind, but focus on the 60 minute chart, as it's the key to whether we continue selling or start a rally back up. I will be looking closely at the daily chart to see if it appears to be hooking back up during Monday and Tuesday's rally.
If it hooks back up, then there is more likely a big rally coming. I'll be looking at the 60 minute charts' histogram bars, and the spy and spx actual price. If the histogram bars start rolling over and falling, but the market starts trading sideways, or just slightly down, that could be a bull flag form, which would mean that the daily chart is providing support to keep the 60 minute chart lifted up.
I believe a move above 1140 spx would be very bullish, and at that point I would re-think the bearish position. I need to see that daily chart hook back up first, before I'll be going long. Right now, it's still very bearish.
Let's move on to the 2nd video where I go over Cobra's charts, Shanky, Kenny, Daneric, and Tony Caldero. Plus, I mention a new website that a friend mentioned that is calling for a Dow 7070 by the end of next week. Yeah... that's pretty bearish! I'm not going to agree or disagree about that bold prediction, but after seeing a 1,000 point drop in 20 minute happen... anything is possible.
Finally, I want to ask a favor of everyone. Please watch one more video...
You can find the link to help here on this site, as well as on Anna's site.
When I wrote yesterday that today would likely be the big down day, causing capitulation, I really believed it would happen. I let my emotions get the best of me on this one, and did a lot of damage by scaring my dear friend. For that, I am deeply sorry, as I only intended to help. I was wrong to push my opinion on someone else, even though I had the best intentions at heart. I guess the best way to help is to say nothing, and just keep your opinions too yourself.
I fear that I may have lost that friend, because of stupidity. I hope not, and I hope that in time she can forgive me for my actions. I'm not perfect by any means, and I'm certainly not that great at trading. I'm too emotional in my trades. I have learned a lot in the last year about trading, but controlling my emotions will be the hardest thing to master. In time, I'm sure I will, as I'm flexible and willing to adapt.
On top of hurting a dear friend, I have also lost a value member of this blog, as it seems that the site is getting too much traffic and drawing too much attention. I wish him well, and thank him for all he has taught me and everyone who listened. May he return someday, when the timing is near...
Since this is a Friday, and I rarely do posts on Fridays' I don't have any charts or forecasts to go over. I'll save it all for the Weekend Update report. I will say that Monday should be an up day.
Good luck to all of you good people, and may the trolls crawl back into their hole.
I will probably do a special video again this weekend, so we can all try to figure out what to do next. Needless to say, once we bottom in the 875-990 area we should all go long. We still have one more high to make this year before we enter into Primary Wave 3.
Our upside target is DIA 118.16 (about Dow 11,800), and we are estimating that to be hit around June 25th, 2010. After that, all hell is going to break loose, as many see us dropping 5,000 points on the Dow before the end of the year.
For all those who believe in God, this will be a time to pray a lot. We have been given the road map over the last 6 months, just as God planned it I'm sure.
I had no idea that I would write this blog a year ago, and that it would change my life and those who follow it. I've always been open minded to learning new things, and I've never trusted the government, but I didn't really know how corrupt they really are... but I do now.
When I first seen the 1047 spx fake print back in January, and then seen it hit the 1044.50 level tagged in February (pierced it a little due to downward momentum), I knew then for sure that the market was controlled and manipulated.
I started to keep my eye open after that, as I was burnt badly on the hard reversal back up from 1044.50, while I was still short. I learned my lesson on that one, and now I pay very close attention to those fake prints, as they are the road map to what lies ahead.
God must have decided to use my skills at building websites (as well as entertaining you with my daily posts, as I'm not really that good of a trader) to warn everyone who would listen, of the coming disaster that lies ahead. He even pointed me some help by allowing Sundancer to find my website and to offer his knowledge of the game, to help others. I doubt if Sundancer knew either, how much help he would be doing when he found my website, and decided to become a regular poster on it.
Many people have learned a lot now, and are hopefully more prepared for what lies ahead. While I really don't like all this doom and gloom, it seems too have found me, and wants me to inform people about it. I would love for it to not happen, and the forecast be wrong, but the charts tell me otherwise.
When the final top is in, I expect to see the moving averages on the monthly and weekly chart come really close together. The monthly will lag the market when it crosses over, but the weekly should almost be touching by the time we hit the high in the market. Unfortunately, I can't stop it from happening. I really wish I could, as I don't want to see so many people hurt from the collapse. The only thing I can do is to warn everyone in advance, so that they can prepare for what's coming.
Anyway, enough doom and gloom for now, as it's making me depressed, even while I'm making money on the fall. For tomorrow, everyone should have their triggers placed in case your brokerage firm goes down during the crash. I can't advise you what to buy, but you can look at Monica's comment on the previous post for a general idea on how to position yourself.