Saturday, December 20, 2025
Home Blog Page 125

Reasons To Be Bullish…

63

ZERO...

zero

Reasons To Be Bearish...

government-lies-no-truth-to-any-reports

Lies, Lies, and more Lies... (Too many to list).

I think this time period will go down in history as the most manipulated time period ever in the history of the stock market.  I've been trading off and on since 1985.  Of course I don't trade for a living, but I've had about 4 different time periods in the last 20 years, that I traded actively in the market.  Each time, I learned more about the market.  In the last year or so, that I've recently been trading again, I've learned enough about technical analysis to profit nicely from trading, yet I haven't "profited nicely".

Why?  because they don't work anymore!  The manipulation being done by Obama and his gang of thugs is unprecedented in any previous time period in history.  You can't tell me that the massive up move from February the 5th is normal.  This market is so overbought that it makes absolutely NO logical sense, pattern, rhythm, or rhyme!  No one in their right mind would go long in this insane market!

Of course going short is just a crazy too...  You'll end up tied down to a table with ropes pulling your arms and legs off, by some bull as he slowly tightens them with one turn at a time.   Slow torture for the bears, and more crack cocaine for the bulls.

This is more insane then the "Dot Com" rally was!  Seriously... at least back then there was some hope or promise of a possible future superstar company that could get you rich.  Today... there's just bad earnings, horrible future outlooks, unemployment numbers off the charts, our national debt 10 times higher, and so much funny money in the system that a gallon of milk might cost $10.00-$15.00 in the near future... when inflation finally takes hold.

Did I miss anything?  Really... how can you be Bullish on the stock market, with the economy in the worst shape since the first Great Depression?  Everyday I see this market inch higher, and I'm just shocked!  How can it continue to go up?  I swear I think the market would rally if some large city in America was destroyed by a nuke or something.  The fracking media would find some way to spin it as positive!  WTF?  ... I get it, all those dead people would reduce the unemployment number, so let's rally some more!

Sheesh... just think how pissed I be if I had any short positions in the market right now!  I don't, as I'm sitting this B.S. out until the insanity is over.  I think it might be only safe to play individual stocks, that aren't as heavily manipulated, then to play the overall market right now.

I hope you guys that are day trading TNA and TZA are doing well.  I don't have the time to monitor the market all day, so I must swing trade.  This time of year is really busy for me, and that why I haven't had a chance to comment much.  But, it looks like you guys (and gals) are doing just fine without me.  Carry on the good work gang.

And keep you eye's out for another large fake print.  I do believe they will let their buddies know ahead of time before they tank the market.  At this point, I don't think I will take any short positions until I see a sign.  This is truly a "once in a lifetime" event (I mean the TOTAL Manipulation of course), and standing it front of it is suicide.  Eventually the money tree will die, and the market will then work on TA's again.

I know that I'm not the only person that thinks this way, as many others that I follow, and subscribe too (who aren't into conspiracies like I am), are now stating that "they never seen anything like it"!  Yes, this will go down in history as the time period where the government "Was" the stock market.

Don't forget that cash is a position... a safe position too!  I'm too stubborn to go long, plus that would be suicide right now.  I'm too scared to go short, as that would be slow torture again... which I'm tired of now.  It's better to just hibernate until something big happens.

Red

Manipulation By The Government…

139

The light volume continues to allow the market to float higher as NO Big Institutions are doing any large selling.  Why?  Simple... they all owe a favor to Uncle Sam.  Put simply, I believe that Obama, Bernanke, and Geithner are sending a message to the big boys... which is "Don't Sell" until I tell you too.

Remember, the government and Goldman Sachs have a revolving door now.  And since Goldman and all the other big banks and institutions stole the tax payers' money, and used it to buy up their own stock... instead of getting it back out to the economy in the form of loans, they now have too listen to what Obama and the gang wants.

What do they want?  Probably to pass that worthless piece of crap health care(less) bill (The actual bill).  I don't know for sure of course, but Obama has been pushing it down our throats for quite some time now.  It's his baby, and he's not stopping until he screws every middle classed American.

health-care-bill-van-side-1

I thought Bush was bad, but Obama is worst.  It's not just the health care bill, it's everything... from this manipulation of the stock market to the outright lies on economic reports, and of the Billion's of tax payer dollars that was given to the crooked banks.  Sheesh... Bushs' biggest lie was the ol' "They got Weapons of Mass Destruction" speak.  He was too dumb to speak about the economy.

health-care-bill-van-side-2

Obama is the slickest crook since Nixon (well, I guess he wasn't that slick after all).  Of course Obama is really just a front man for the real people that run the country, behind the scenes.  I think most all elections are already planned out who is going to win, and become the next president... just like the cities are already picked out for the future Olympic games.

Regardless of who is running the country, the manipulation in today's market is absurd.  So trying to forecast this market is just as absurd.  I'll repeat it again... just to hear myself say it!  "This market is EXTREMELY Overbought and should sell off some very soon (like last week)".  Will it?  Of course not.  However, it should (might... maybe... LOL)  sell off after option expiration is over this Friday.  But a BIG Sell Off might not happen?  We'll just have to wait and see...

Red

Weekend Update…

125

bernanke-qe-cartoon

I guess we are back to the "Shoulda' Woulda' Coulda'" forecasts for the market now.  Yes, it should have already rolled over to the downside.  And it would have done so if we had any real volume in the market.  But, it also could still go higher?  There... now I've covered it all!  LOL!

As for next week... once again, it should roll over to the downside.  Will it?  Who knows?  This market is so controlled it isn't even fun anymore.  Any selling is quickly bought up by computer bot programs, and as long as the big institutions won't sell their shares, the little guys will never succeed in pushing this market back down.

It's truly up to the big institutions, as the selling will only stick when they start selling.  When?  I don't know, but we seem too be very close.  Too many signs of this damn cracking are appearing now.  Eventually one of those big boys will hit the panic button, and the rest will follow.

I heard somewhere that this last week ranked in the top 10 lightest volume weeks for the last 6-7 years.  And it's March!  WTF?  I'd expect it in the summer, or around a major holiday, but not during the month of March.  Man... when this market manipulation finally fails to work anymore... look out below, as this pit might be bottomless!

One of the signs that the market is cracking is the fact that both oil and gold sold off Friday, while the dollar was getting hammered.  Good ol' Ben was out in force on Friday, the dollar got kicked in the groins again.  The poor little dollar... you actually feel sorry for it.  It's the governments' punching bag it seems...

Also notice that the market did not rise proportionally to the dollar being sold.  The market actually ended down by a fraction.  It should have been up 100 points or more on the Dow, with the dollar getting sold off so hard.  It didn't... which clearly indicates that this inverse relationship between the two is struggling badly.  Eventually, it will cease to work, and the market will sell off with the dollar.  When?  Unknown... but these current observations are clearly pointing to a top in the market.

The VIX has also inched it way up, which is another indicator that we are nearing a top, or already at one.  Volume is all we need in the market.  Give me volume, and I'll give you selling!  It's really that simple!  The pit bulls (big institutions) are currently on their leash and sitting still as their master (the government thugs - Timmy, Benny and Obama) have told them to do so.  And for now, they are listening.  Soon they will get hungry, and break that leash.  Then the fun starts!

One more thing... let's also not forget that the Fed's are cutting back on their Quantitative Easing, as Obama stated recently that they will be trying to reel back in the money they've put out into the system.  Good Luck on that Mr. Dreamer!  Goldman already moved that money into the Cayman Islands...

I'd post some charts, but what's the point... the market is going to continue up, until they want to sell it.  Charts, Astrology, Moon Cycles, etc... don't affect a computer bot buying machine.  All that is calculated based on real people... that have emotions.  Machines don't have emotions, so a lot of the traditional ways to predict the market are history.

Welcome to the machine...

Let's hope that this isn't what happens to the stock market and the economy in the next few years...

Red

Sorry gang... I got really busy today, and didn't have time to do a Monday post.  Doesn't look like I missed anything anyway... I'll get one up Tuesday.  Meanwhile... make the market sell off, would you? LOL

Who Said Pigs Can’t Fly?

3,187

Flying-Pigs

I mentioned a few days ago that I expected the market to do one of two things... either rally up just shy of the double top at 115.14 spy, and then tank, or break above it to lure in retail traders to short at the double top.  It looks like we have the second scenario, as the market went through the previous high of 115.14 spy.

Since it is just barely above it now, I do expect a little higher push to squeeze out those new shorts at 115.14 spy.  I said previously that we could add .50 cents to 1.00 above the high, and that's still in play.  Think like the big institutions would.  Why would they tank the market now, and let all the retail traders make money with them?  They wouldn't, as they want to take the retail traders' money from them.

So how would you do that if you were a big institution?  I'd push the market up to the next major resistance level, somewhere between 116.10 and 116.35... which would have all those retail traders who went short at 115.14, bailing out on their shorts with a loss.  Many will even switch sides and go long... at which point they will sell it off hard.

So, unless some really bad and unexpected news comes out tomorrow, I hate to say it, but these pigs could fly for another day.  It's really a frustrating market, controlled a 100% by the government.  I'm sure they have supercomputers scanning the internet blogs, and reading the bullish or bearish sentiment.  They have the money to keep the market up, and all the inside information.  I only expect it to get tougher over the years.

I don't know what will be the reason to sell off the market, but it will probably come when you least expect it... like overnight.  Don't know how far it will go down either, but I'd expect that gap at 113 area to be the first stop.  But, for tomorrow, I expect more of same... more pigs flying.

Red

No Friday Post. The Weekend Post should be up by late Sunday night.

For your entertainment, and to just mess with your head some more (as if this crazy market hasn't already done that), here is cool trick...

If you take a look at the following picture, let me tell you .... it is not animated. Your eyes are making it move.   To test this, stare at one spot for a couple seconds and everything will stop moving.   Or look at the black center of each circle and it will stop moving.   But move your eyes to the next black center and the previous will move after you take your eyes away from it Weird ?

swirling circles

Now go get drunk, and don't worry about the stock market for a day or two...  (or smoke some wacky weed if that's your thing.  Just enjoy life for a little while).

Grinding On Up…

78

Grinding-On-Up

The market keeps on grinding it's way higher, as all the bears are gone (or dead), and the bulls aren't selling yet.  When will they dump the market?  When the last retail trader boards the bull train I guess?  Could we go higher?  Yes, of course we can.  Wouldn't it be poetic to top out at 116.66 spy, just like we bottomed at 666 spx.  Games people play... you got to love the irony.

Here's something that's funny.  Notice in the chart below that we actually bottomed out at 104.58 the same day the 20ma (blue line) crossed down over the 50ma (red line).  Now we are about to see the 20ma cross back above the 50ma... which is considered bullish, just like the cross down was bearish.  Yet, it seems to be too late when it crosses, as the down move was over by then.  Will the up move met the same fate?

The-Chart-Pattern-Trader-spy-daily-03-10-2010

Of course I don't know the answer, but it seems too me that all this light volume slow grind higher, is designed to wear everyone out.  Let me tell you... it's working!  I'm worn out with all this crap.  And, I'm tired of writing about doom and gloom too.

I'd write about something positive if I could find some, but all the news on the economy is still bad. Cisco is coming out with a router that's supposed too be 12 times faster then standard routers.  Now that's exciting news!  Maybe I should go long on the stock now?  Yeah, and I'll long on BIDU too!  This market is so overbought that it looks like a 1,000 pound fat man.  How long can this last?  Not too much longer, as the damn is cracking.

Notice how the dollar was down today and so was gold.  Why?  Don't they usually trade the opposite direction of each other?  Yes, they do.  But, gold is a safety play too.  And when the people think that the market is safe now, and that they can make more money in stocks, they will sell gold and buy stocks... regardless of what the dollar is doing.  Now that tells me that we are so close to a top, that it's not even funny.

Add the large VIX buy on Monday, with the large sell block of Goldman on Tuesday, and today's gold action... and you have many clues that the top is in, or just a hair away from it.  Is it the final top?  I doubt it, but it should be good for a nice 5-10% correction before moving higher.  After that we could go up and tag the 50ma on the weekly chart.  Summer time is slow in the market, and that's when I'd expect a move up to that level... if it happens?

Ok, that all I can think of to say.  I'd complain some more about Goldman or how the market is extremely manipulated, but it wouldn't do any good.  Plus, Goldman isn't doing anything right now.  It's all the little retail traders that are pushing it up one dollar at a time.  And since the bears are all hibernating (or dead), the only way the market is going to fall is if the institutional bulls decide to dump their longs.  That's really what we are waiting for now. We need to see the first one sell, and then the others will join in too.

Unfortunately, we need some more bad news... really bad news, to get the selling started.  It would be easy to start a fight between all the big boys if we were in school.  We could just start a rumor about each of the baddest boys, and tell each of them that the other one said it.  They would all turn on each other, and the fighting would begin.  I remember girl's that used too do that all the time.  They did it to make the boys jealous.  Too funny it was, (and many year's ago).  If life were only that simple today...

Red

P.S.  Just for you Bear's out there...

Are We There Yet?

72

are-we-there-yet

Another light day as the market rose up slowly to reach 114.99... just shy of a double top at 115.14 (spy).  Will they get there, or will they start a sell off from this level?  Seems to obvious too me that everyone and their brother is waiting to sell their longs at 115.14, and go short... which is why it's unlikely too happen.

I think we will either start the selling from this level, or pierce through the top about another .50 cents to 1.00 (5-10 points SPX).  It makes perfect sense when you think about it.  If you sell at this level, the retail traders will be stuck in their longs, still waiting for the double top to get out.  They will also miss the chance to go short.

If on the other hand, the big institutions decide to take it to a double top, and allow the longs to get out and go short, I suspect that they will squeeze those new shorts by rallying higher to 116.00 or so.  Then, they will sell off the market... after the retail trader bails on his shorts and go long again.  Trapped again... that's how the big boys play the game.

So, tomorrow could either rally on through the 115.14 level, to put in a higher top (and then sell off), or just start selling off tomorrow.  We really need some news event to come out, so they can have something to blame it on.

Yesterday there was a large block of 3 million shares bought on the VIX, and today another large block (1.5 million) of shares sold on Goldman Sachs.  Someone knows something... that's for sure!  Since Goldman basically "is the market", the large sell order there is something worth paying attention too.  If they had an average price of $170 per share, that's $255 Million Dollars worth in one 10 minute period.

Combine that news with the VIX buy on Monday, and I think it's clear which direction they plan on taking the market.  When is the real question?  Will it happen tomorrow, or will they wait for the jobs info on Thursday or Friday?  I don't know, but the pressure is building up... that's for sure.

Do they have enough steam left for a quick head fake to 116.00 area, before the selling starts, or will it be from today's 114.99 high?  We'll see tomorrow I guess...

Red

Weekend Update…

81

Is it over?  Is it finally over?  I mean the slaughtering of the bears last week of course.  Not quite yet, as the bulls are just too close to 1150 to stop now.  It would shock me if they didn't push up a little more and put in a double top.  After that, well that another story...

It should be quite obvious to everyone by now that the big institutions haven't been buying or selling while this light volume market floats up to the clouds everyday.  Why?  Because they already bought at the low last February the 5th.  They are now waiting for a final top to be put in before they unload again... to the unsuspecting public of course.

Look at this chart below (from Cobra's website) that shows where all the gaps are on the way up from that 104.58 spy low.  (He drew rectangle boxes to point them out).   Notice that there were also gaps on the way down from 115 to 104, and that all of those gaps have now been filled... except for one.  That area between 114.50 and the 115.14 high still hasn't been filled.  That's why the market will continue up on Monday or Tuesday most likely, and fill that gap.

cobra's-60-minute-spy-chart

In the chart above, note that the closing price on January the 29th was 107.39 spy.  Remember that I was able to catch a fake print on February the 17th, showing 107.38 as the low of that print.  Odd huh?  Is that where we are heading next?  Or possibly a newer fake print I caught today (March 6th, 2010) of 105.47 spy.  Something is weird here.

fake-print-03-06-2010

Maybe that print was always there, and I just missed it?  I don't know?  It's an old print now, as the date is from December 14th, 2009.  Here's another one when I go back 6 months on the chart (I only went back 3 months in the chart above).

fake-print2-03-06-2010

The low on November 18th, 2009 was 103.78 spy (that's the fake print number, not the real low for the day).  Again, maybe these prints were already there, and maybe they don't mean anything.  But, you should still keep those numbers in the back of your mind, as the previous major fake print of 1047.28 SPX did play out as the market dropped to 1044.50 just a month later on February the 5th, 2010.  Of course it pierced the fake print level a little, but the hard reversal back up... with very large volume, was a clear sign that the fake print was accurate.

Back to next week...

What will cause a sell off to happen, you ask?  How about some more bad news too be realized, so that the media will have something to blame the sell off on.  The big institutions are going to start unloading those shares soon.  When is still unknown?  Since they haven't participated in buying on the way up, it's unlikely that they will start buying now, so that the market can push though the double top resistance and start a new bull rally.

I guess it's possible, but highly unlikely at this point.  They have had plenty of bad news released in the last month to give them a reason to sell and take profits.  I think we are going down to the 104 level for a double bottom.  The 200dma is about there now, and probably will be at 104 by the time we get back down there.

How fast it gets there is really based on what level they want to close the SPY on by option expiration.  I'm not sure if they will take one week, two weeks, or the rest of the month?  Regardless, once they take it down to the level that have targeted (I'm only forecasting the double bottom area.  It could only go down to put in a higher low), I do believe it will bounce back hard.

From that point... I don't know?  Will the possible double bottom put in a solid support and allow a rally to go up and break the 1150 top?  Or, will we only bounce to some Fib level, and then fall back again... taking out the 104 level on that trip?

The weekly chart still hasn't had a cross back down on the moving averages.  The 20ma is still above the 40ma, which tells me that the trend is still up.  Also, the MACD is still putting in lower Histogram bars and they are still smaller, and rising to the zero mark.  Will they cross and and go positive, putting in a lower tower then from the March 2009 area?

The-Chart-Pattern-Trader-spy-weekly-chart-03-06-2010

That will really depend on how much money the Fed's decide to pump back into the market.  Right now, they are trying to pull back the quantitative easing.   The average Joe trader doesn't have any money to put in this market, as they are probably trying to draw unemployment right now.  The crooked banks aren't going to use their stolen profits to pump the market up more.  So, that leaves the government.

At this point, the government is getting a lot of heat from other governments around the world, about the massive printing of the dollar.  That of course devalues it, and since other countries hold dollar denominated notes of some kind, they stand to lose billions as the dollar goes down.

Which leads me to believe that the government can't afford to put too much more money into the market.  That will put a topside limit on how high the market can go during the summer months.  How high you ask?  I can't answer that, as the top could already be in, or more stimulus money could push it up higher to 1300 or higher?  The 200 week moving average is at 1227.67 today, and then there is the peak in May of 2008 around 1320 area.  That would be the next level of resistance.  It's too hard too tell right now.

My personal feeling is that they will go down to sideways throughout the summer, not taking out the 1150 high, but not totally crashing below 900 either.  Then later this year, a big sell off.  The in-between area from Spring to Summer could go either way?

Ok, enough of the longer term picture...

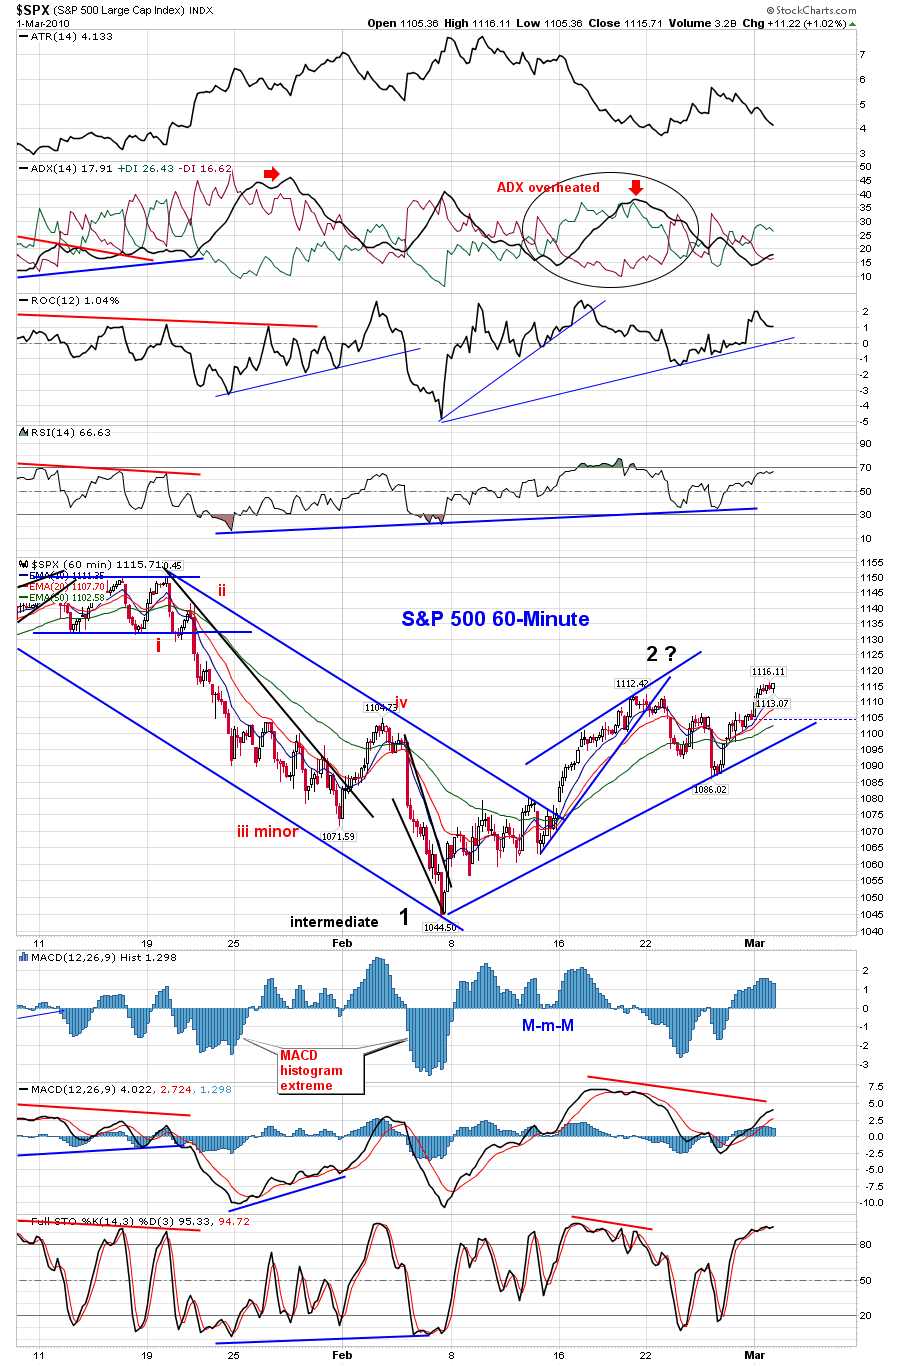
Let's move on to next week.  Since there will probably be a ton of people waiting to go short at 1150, I don't think it will happen.  Instead, I see two possibly scenario's.  One, we go just shy of 1150, maybe to gap window on the 60 minute chart... which is about 114.50 spy, just a hair above where we closed on Friday.  Then the sell off starts, not allowing the retail trader to get in on a short position.  Or two, we go up to the 1150 level and pierce it by going a little higher.  Anyone who went short would get squeezed, which would be the fuel needed to push up another 10 points or so.

Either way, a sell off is likely to occur afterwards.  I really don't see the market getting through the double top, as a lot of bears are going to jump on at that level.  I think they will continue adding short positions on any pierce of that level too.  With that much selling pressure, and institutions wanting out of their long positions too, where is the money going to come from to rally higher?  Will Goldman buy at 1150?  I think not...

Most likely Goldman will be selling on every touch of 115, providing even more resistance to the unsuspecting retail bulls.  We could trade flat for a few days, bouncing up to 115, and down to 112.50 while the big boys unload their shares.  The problem with that idea is that they have very large positions, and when they really decide to sell their shares, the market will sell off hard.

However, it won't be the bears pushing the market down, it will be the big institutional bulls.  So, I can see some light at the end of the tunnel now, as I believe this bull train is coming to a stop.  Get your boarding tickets out bears, and be ready to climb aboard.  Next stop... Dark Territory.

Red

_______________________________________________________

Update for Monday...

No point making a special post for Monday as this was about the flattest day of trading I've seen in a long time, and nothing has changed.  The volume was the lowest all year, with only 106 million shares traded on the SPY.  Since Monday's are usually the most bullish day of the week, and the spy only moved up .01 cents, not making a double top as many people expected... I'd say that's pretty bearish.

A big move is coming... up or down, who knows?  I suspect down, but the market seems to fool me every time I say that.  So, I'll only forecast a big move  (I've ate enough crow to fill my belly for many weeks).

Red

Pop and Drop…

238

Friday Update...

We got our POP, now let's see if we get our drop over the next couple of weeks?  More on the weekend update.  Enjoy your weekend, as it seems the snow is starting to go away and warmer weather is coming back.  (Just be sure you show up to work for at least one hour per week, if it snows again... that way you will still be counted as employed, as far as the government numbers go).

----------------------------------------------------------------------------------------------------

pop-and-drop

I'm looking for a pop and drop tomorrow, as the market needs to shake out the last bear standing.  Some better then expected, or not really so bad, jobs report should just do the trick.  Let's rally up to the 113.00-113.50 spy level, and close that 1127 spx gap, and be done with this stupid bull manipulated rally.  I'm over it!  Get it done, so the fun can begin!

Once the selling starts, I don't see another rally like this until we tag the 200mda... which should be at about 104 (spy) by now.  That would also be a double bottom.  It might take a few weeks to get there, but I fully expect a sell off to start next week.

That's it... no long drawn out post tonight.  Just a call for a top to be put in tomorrow, and then a sell off through all of next week.  That's what my crystal ball tells me, and that's what I'm expecting to happen.  Of course if I'm wrong, I'll just eat some more crow.  I'm actually getting used too eating crow, and it doesn't taste too bad anymore. (LOL)

Red  🙂

Falling Dollar…

382

falling_dollar

The dollar sold off today pretty nicely, but the market didn't rally by the same proportion.  Does this mean that the dollar and the market are finally starting to disconnect?  I not going to say that, but it does tell me that the selling of the dollar isn't causing the market to rally as much as it used too.

That's a clear indication that the market is exhausted, and ready to roll over.  Look at the selling in the afternoon when the dollar was still flat (after selling off in hard in the first hour of the day), and look at the market. You will notice that the dollar never really moved much the rest of the day, but the market sold off.

Even with the light volume that the market has had recently, it is barely able to stay positive today.  Meanwhile, the Nasdaq and the Dow actually closed lower.  However, I do believe it will go up to that 1127 level first, before any selling is going to happen.  That gap needs closed, and who knows if the market will ever get back this close to it or not?

Of course after a 10-20%, we could rally back up in the summer and make new highs... as anything is possible when you can print all the money you want, and fudge any economic reports.  But, that might not happen, as this market could continue down for the next few years.

Or, they really can stop "the great depression two" from happening... and I think I saw a pig fly by my window!  Never mind, that was just a dream... just like the government's plan to save the economy.  The only thing I see them saving is their retirement accounts, as they are making sure those get inflated by lobbyist donations before they leave office to go to work for Goldman Sachs.

Anyway, I'm drifting off subject, as I don't know what to tell you about tomorrow?  Probably another choppy day ending flat to down, while we wait for Friday's job's data.  That should produce a sell off if they are really bad.  Of course you can't really expect the government to release bad numbers, as they are quite easy to fudge (aka... Lie!).  On the other hand... what if they want the market to sell off, as they are already positioned short.  Just food for thought.

Red

Black Candle Tuesday…

62

What do Black Candles on a chart mean?  Look at the chart below, and you tell me.  Look at what happened after each black candle occurred.  I can only find one time that a black candle occurred and the market continued in the same direction the next day.  That was the first week of November.  Notice that a black candle occurred after an up day, and the next day continued up too.  Other then that, every black candle produced a move in the opposite direction the next day.

sc

So, does that mean the top is finally in now?  Maybe?  Or maybe we just pull back for one day and then rally some more on Thursday and Friday.  There is some heavy resistance at 113.00-113.50 spy, and that might be the finally high, before a nice sell off.  Or, today could have been the high?  I think it's all about the ADP numbers out tomorrow morning.

And since they already released some rumors that the numbers aren't good, in an attempt to lower the market expectations, I think we are nearing an end of the crack driven rally these bulls have been on.  A turn is coming soon... if not tomorrow, then Thursday or Friday should produce a final top, and begin some selling.  Nothing goes up forever... not even bulls with unlimited funds.

Red

And here is a special song for the bulls (aka Johnny), entitled "Shooting Star" (Black Candle)...

Typical Bullish Monday…

154

Well, it comes as no surprise that today up again.  After all, every Monday is now bullish... a new rule created by the people who control the market.  Of course we all know who that is... but I won't rant on them in this paragraph, I'll save it for another.

Did you notice that the dollar barely sold off any today?  With a strong dollar, and the market and the dollar still being on opposite sides of the coin, you would think that the market would have been held back from rallying... but the extremely light volume (147 million) allowed the market to float higher (despite the flat dollar).

It seems quite clear that the big institutions aren't selling or buying right now.  They are simply sitting on the sidelines and waiting for the retail traders to push it up to the magic level before they dump their stocks.  What is that magic level?  I don't know?  It could go back up to the 1150 area for a double top, before selling off.

Since all the bears are broke, and the institutions aren't selling, the only person left in the game is the retail bulls.  They will continue to buy, pushing up this market, until the big boys want to dump it on them.  If the retails get weak, the buy programs will come back in and bait the retails into buying some more.  Almost like a horse on a race track, with a carrot dangling just out of reach, in front of his nose.

Of course the bears can't even be found in this picture, as they are horses that have broken, bruised, or worn out body parts, locked up in the stall... trying to mend their injuries.  That's me of course... beaten, bruised, not quite broken yet, but trying hang on and get ready for next race.

So, what about tomorrow you ask?  I think we are going higher.  Yes, I know... why am I bullish now?  I'm not... but the charts are looking bullish too me.  I like being a bear, but the market is looking more and more bullish everyday now, and as much as I'd like to see a nice sell off, I think we have to go higher first.

Looking at the 60 minute chart below, I see that the RSI is now 66.63, which means that there is now "2 buys to every 1 sell" in the market.  Or 33 sellers to every 66 buyers.  That's a bullish sign on the 60 minute chart.  Notice also that the positive DI line is now on top, which means we are in a bullish mode.  The ADX line is still quite low, which means that there isn't much strength in this bullish mode.  But, as long as the market still has light volume, they can push it higher... at least for the short term.

Now, looking at the daily chart below, you can see that the RSI is only at 57.45... which means that it leaning bullish, but still could go either way.  The ADX line is now under 20, which tells me that a big move is coming soon, as it should curl back up and giving a lot of strength to whichever line is on top.  I believe that will be the negative DI line, as whichever one gets on top should stay there for a few weeks... and I don't see the bulls rallying up for another month.

sc

The monthly and weekly charts don't support a rally up to 1250-1300, which is where we should head if the positive DI line is on top when the ADX line starts to rally up (on the daily chart).  Those charts don't turn on a dime folks.  That's why I don't see this month closing higher.  Just look at that ADX line on the daily chart above, and notice how long the line spent above the mid-point level of 25.  I count about 4 weeks... which is about what I'd expect to happen again, once it breaks above that level.

So again, we could go up a little more tomorrow, as they control this market until big volume comes back in.  When will that happen?  Probably this Wednesday through Friday, as the economic news shouldn't be viewed too positively, but no one except those "on the inside" can really answer that question.

Red

Weekend Update…

429

I see no point in trying to forecast intraday, or even daily moves in this extremely manipulated stock market.  So, I'm going to focus on the weekly instead.  Let's look at the weekly chart below...

The-Chart-Pattern-Trader-spy-weekly-chart-02-28-2010

We are clearly forming a nice bear flag on it, as we have now completed 3 weeks of a down move, and 3 weeks of an up to sideways move.  Notice that last week was basically flat (down a little), putting in a bearish hammer candle.  If this bear flag plays out, then we should head down to the 104 spy double bottom area by the end of next week.

I suspect that the jobs numbers will be really bad this week, and will be blamed for the sell off coming.  But that doesn't come until later in the week.  So just remember, most Monday's are bullish, and I've rarely seen a big down day on Monday.  That doesn't mean it won't happen, only that it's not likely.  If Monday does push up a little more, then I think the target will be the 112.00-112.50 area, as it's provided great resistance in the past, and should continue to do so.

If that gets broken, then we are heading for a double top at 1115 spx.  I really don't see that happening with all the news out next week.  The bulls seem to be just about done now, as it's going to be extremely hard to push up very much further.  From the Monthly to Weekly charts putting huge downward pressure on the market, to the seasonality of March, and multiple turn dates coming up... it's not looking good for the bulls.

lloyd-blankfein-testifing-god's-work

But... and this is a big butt, the bulls still have GOD on there side!  Yes, Goldman Sachs (aka God... at least in their sick minds) still has your money, and your children's money, and your children's children's money too use to buy up the worthless stocks in this doomed market.  (Personally, I thought God was a giving and caring person... not a THIEF!  That tells me they are doing the Devil's work... not God's).

Anyway, that simply means that NO about of Technical Analysis I do is going to be accurate with all the free money still manipulating the system.  If you have unlimited funds to keep the market up, then no about of selling will ever stick.  Anna seems to think that we won't get any significant downside until Obama pushes his worthless Heathcare system through.  That very well could be right?

Remember this... from the creation of the stock market, until the present, there has always been manipulation in the system.  However, the control that they have had, was limited by the amount of cash they had to work with.  When the PPT (Plunge Protection Team, created by Ronald Regan after the 1987 crash... which was originally designed to simply prevent further crashes, not manipulate the market) was created, the crooks seen that as an opportunity to have free funds from the government, instead of using just their own.

In the beginning, the amount of funding to the PPT was not nearly enough to fully control the market with the normal volume that occurs throughout the year.  But with light volume during holiday's and certain times of the year, the PPT soon discovered that they could fully control the market and push it in whichever direction they wanted.

Then along came March 6th, 2009... which forced Obama to turn the money flow on full blast, giving unlimited funds to the PPT (aka Goldman Sachs).  Their humble leader Lloyd Blankfein (aka GOD), does just what any good crook would do... buy up his own stock, almost tripling it in value over the next year.  Then, pay himself and other bankster pals huge bonuses with all the money that he had stolen from the unsuspecting American public.

What does all this mean?  Simple really... it means that you can't really use TA's anymore to forecast the possible direction with any kind of real accuracy.  I do believe that technical analysis still works on most individual stocks and some commodities... but not the overall market right now.

If it sounds like I'm bitching and complaining again... you're right, I am!  What good does it do to study charts, learn Elliottwave, Technical Analysis, Fibonacci Retracement levels, Astrology, Gann or Bradley turn dates, and any other forecasting method, if none of them work anymore.

I've always known that trading was very difficult, and not very easy to become successful at.  I've been through the "school of hard knocks", and I've put in my time in studying and learning the techniques that are available t0o be learned.  Obviously, the "real techniques" and secrets are buried inside Goldman Sachs, as I can't find anyone else who can figure out where this market is going next... can you?

Red

Bear Shake…

40

NO POST FRIDAY... NOTHING CHANGED!

NEXT POST SUNDAY NIGHT.

This is How I feel... Clueless!

yellow_guy_smiling_really_big_hg_wht

bears-in-a-tree

More bears were shook out the tree today as buy programs come to the bulls rescue once again.  Yes folks, we should have tanked again today, but the crooks at Goldman and the Government stopped the sell off with their computer program algorithm machines.

It's just another way of shaking more shorts out of their positions.  You sell off one day, get the bears to go short at the low, rally back up the rest of the day to squeeze them out.  Then sell off again the next day, get a second round of bears to go short at the low, and rally back up again... squeezing once again.  Is tomorrow is the third time?  Or, will it sell off for real this time?  I doubt it.  If it sells off tomorrow, I'd expect at least one more rally back up to shake the last bear out the tree.

Then, release some bad news over the weekend and gap down on Monday with no bears in the market.  Wouldn't that be UN-expected?  When is the last time you seen a negative Monday?  It's been too long to remember, so I'm certainly not going to predict that "this time will be different", and Monday will be a big down day.  I don't have a clue as to what will happen on Monday.

I can say that by all Technical Analysis, we should sell off again... but you know that's not going to happen as long as Goldman runs the country.  On an even funnier note... Goldman is now to be investigated over the Greece issue.  And guess who they want to investigate them?  You guessed it... Ben Bernanke!  Yes folks, it's time to appoint Al Capone as lead investigator into Mob Crime.  (ROFLMAO).

What a fraking joke?  Just line them all up and give me a high powered rifle.  I'll put an end to it... once and for all!  That's about the stupidest thing I've read today.  When will Americans wake up and go hang these crooks?  Let's get a lynch gang, find the tallest tree, tie some electric cable too it, and hang and fry 'em at the same time!

Anyway...

I've been around a lot lately, as I haven't been working for the last few weeks.  As most of you know, I try... and the key word there is "try", to swing trade, not day trade.  But, that's been almost impossible lately with all the huge intraday moves back and forth.  Luckily, I've been around to save my bad trades (some of them at least).  But, next week, I'm back to work, and will be dropping in less as I get too busy to chat all day.  (But, feel free to continue chatting without me, as I post everyday on this blog for you guys and gals... and also as an outlet to "air out" my frustrations).

Now, as for tomorrow... well, most Friday's are flat to up, with light volume as the traders leave early for the weekend.  That means we could drift up a little all day and end up closing flat.  Of course I posted yesterday that I thought today would be flat to up... and was dead wrong, so don't expect Friday's forecast too be any more accurate.  I guess I was right on the fact that we ended about flat for the day, but the way off on the intraday swings.

If I do start getting every call accurate, then you can assume that I just got a new job at Goldman Sachs... as they are the only ones' that know where this market is going tomorrow.  Don't worry though, I've bad mouthed them enough that they would never hire me anyway.

From a technical point of view (not that technicals actually work anymore), I'll refer you to this chart by Cobra.  As you can see, today we had what is normally called a Hollow Reversal Candle.  In this case, it would be called a Bullish Reversal Candle... but, as Cobra points out, we are too close to the top, to reverse back up.  That means it could go either direction.

cobra's-daily-spy-chart

Hollow Reversal Candles work pretty well when they are at a top, or bottom... but not in the middle of a trend move.  You will also notice in the chart that we are still below the 50 dma, which is currently still holding the bulls back.  Unfortunately, the 20 dma also stopped the bears on today's move down.

So, that leaves us with no clue about tomorrow... except the fake print at the close today, that showed the 109.20 spy area as a possible target for any sell off tomorrow.  But, it doesn't have too go there tomorrow... it could be Monday, or never?  They have been quite accurate lately, but you never know when they will decide to stop it.

Anyway, I did take a small short position around 110.40, with a 109/104 put spread.  If we go down to that 109 area again tomorrow, I will close them out, as I'm not holding over the weekend into Bullish Monday (and that will of course be the day they gap down huge on, as that's just my luck).

Red

Still In Rising Channel…

705

Some wild swings in the morning, and then some sideways chop until the close...  but we're still in the rising channel on the 60 minute chart below.  I didn't think the move down yesterday was going to stick, as the volume was just too light.  The 1092 level that held yesterday, will move up tomorrow to about 1097 on the lower trend line on the rising channel.  Will it hold again tomorrow?  As long as the volume stays low, then the answer is most likely YES.

The-Chart-Pattern-Trader-spy-60-minute

Today's volume was only about 175 million on the SPY.  That's just too light for any sell off to happen.  The markets are still being held up for now.  My feeling on tomorrow is that they already know that the Initial Claims and Continuing Claims numbers are worst then expected.  So, how do you keep the market from selling off huge on the numbers?  You release other bad news like the Consumer Confidence numbers, and New Home Sales 2 days ahead of that.

The expectations will be lowered in the minds of the traders, so when the numbers are released, it won't have as big an impact.  Smart crooks, these Fed's are...  You have to give them credit for that.

Next, what I would do is to rally the dollar over night, then sell it hard at 8:30 am when the Claims numbers are released.  That should keep the market from selling off too hard.  Crooked isn't it?  Of course it is... but a year ago only 1 out 20 people asked would say that the market is manipulated.  Now, I'd bet 1 out 2 would say it is...

Clearly, without the stimulus money, the market would probably be below the March 6th, 2009 low by now.  All this manipulating is really going to hurt the economy long term.  It's like they are slowly pulling the bandaid off from the big cut or sore on your body... pulling one hair at a time.  It would be a whole lot less painful to just jerk it off quickly and be done with it.  Sheesh... every parent knows that.

But, I guess we don't have adults running the government... we have children.  They cry when things don't go their way, throw temper tantrums, and fight among each other.  Yep... sounds like to children too me!

Move on...

Looking at the chart above again, I'd say we could chop a little higher until the end of the week, as the MACD is rising up into positive territory, and the ADX line is still pointing down.  The ADX could bottom on Friday or Monday, and then start to curl back up, giving strength and momentum to whichever DI line is on top.  My thoughts are that the negative DI line will start to rise at that time, and nice little sell off would occur.

This will line up nicely with the weekly chart putting in a nice bear flag too.  Just keep in mind that during light volume periods, the market rarely sells off.  It usually goes up, or sideways.  So, I'm looking for the ADX to find a bottom and start to turn back up while the spy is also hitting major resistance level.

Those levels are 111.50 spy (about 1110-1112 spx), and the best level is 112.00-112.50 spy (about 1115-1120 spx).  I would love to see 112.00-112.50 by the close on Friday, as that would be an ideal place to go short over the weekend with a put spread.  It may not happen though, as that target might not be hit until the usually bullish Monday next week... but, what if Monday starts a nice sell off?  Would that catch the bears by surprise?

Hmmm, bear flag on the weekly charts, major resistance at 112.00 area, February closes out positive, new month to start next week, and maybe some bad news released over the weekend?  That sounds like the perfect setup to fool a lot of bears... and bulls too!  Will it happen?  Who knows?  I'm just throwing it out there for you to decide.

Red

Strange Sell Off Today…

59

The market sold off today on a worst then expected consumer confidence number.  Duh!  I could have told you that!  Well, I guess they have to have something to blame the sell off on.  It's not like they are going to go on TV and say how extremely overbought the market is, and that's why it fell.  Of course all traders knew we were due for a pullback, and the news is just the reason to make it happen.

Looking at the chart below you see that we broke out the rising wedge yesterday, and fell down to the lower trend line on the rising channel today.  This did put the 60 minute chart in an oversold position, which means we should trade sideways to slightly up tomorrow, before starting a nice move down on Thursday or Friday, as I mentioned on my weekend post.

The-Chart-Pattern-Trader-spy-60-minute

One thing that makes me think that we will pause tomorrow, before heading down more on Thursday or Friday, is the light volume of only 207 million shares, that traded on the SPY today.  All of the other large down days were 300 million plus.  That tells me that the big institutions weren't selling too heavy today.   It was still a nice sell off though.

And, this is clearly a signal of what's coming soon, as I think the market was really surprised by the consumer confidence number today.  Otherwise, they would have backed the market down a little slower, and in a more controlled fashion.  If that 109.80 level broke, the market would have really started falling.  Notice how they rallied it up to close right above that master support level.  They made it by one penny, at 109.81 on the spy.

Let's see if they can keep it a float again tomorrow.  I can't answer that of course, but if I had to guess... I'd say they would, at least for Wednesday and maybe Thursday too?  As for Friday, I think we will start the next leg down by then... which will continue into next week.  Remember, they are trying to close this month out positive, and Friday is the last day of the month.

So, after the month of February is done, March is free to sell off.  Now whether on not that is P3... who knows?  I'd just be happy for a nice big sell off at this point.  I can't see that far into the future, as my crystal ball is too cloudy right now.  Must be all that snow still stirring around from earlier this month?

Red

P.S.  One more thing... let's not forget that fake print last week at 107.38, should we start selling again tomorrow, as that would be a likely target for a bounce.

Light Volume Equals A Boring Market…

330

With only 132 million shares traded on the SPY, the market basically went nowhere.  Nothing has changed since the March low from 2009, as light volume still rules the market.  Ever since the cap was removed for the PPT, they have easily been able to keep the market flat to up on every light volume day the market has.  Of course the market has always been controlled to some degree, but when you now have an unlimited supply of free money, the control they have now is the highest it's ever been.

As much as I'd like to see a nice sell off, it's not coming until the big institutions decide to sell... it's really that simple.  The technicals didn't really change much today, as we are still over bought short term, but we can still go higher medium term.  However, I'm still looking for a small pull back later this week, but I'm not expecting too much.

Don't take this wrong, as I'm not bullish by any means... but I'm not bearish right now either.  The market is being propped up, and I'm not going to fight it... as I'll lose.  Here's an interesting video by my favorite president (I wish)...

For this week, it will be important for the master resistance at 112.00-112.50 to hold the bulls back.  If successful, then a pullback could start as early as Friday.  What I'm looking for, is for the adx line to bottom out, and start to re-cycle back up, with the negative di line leading the way.

Now if the 112.00-112.50 level fails to hold back the bulls, then we should see a move to 115.00 area for a double top next week.  I know that's not what you're looking to hear, but we are in a sideways market right now, that could break either way.  I'm going to remain neutral for now, and hope that 112.00-112.50 holds for the entire week.  I believe that if the level does indeed hold... for the entire week, then next week will be down.  Can the bears hold back bulls?  Only time will tell, as the market is just trying to put the bears to sleep right now.  Once they are all hibernating... the market will sell off.  Isn't that just the way it works?

Red

Weekend Update…

61

Bullish Monday again?  Yes, it's possible...  I know us bears can't seem to believe that the market could go higher, but it can.  When you look at the technicals, the ADX (advance/decline line) clearly shows that the bulls are still in control.  The adx line is now rolling over and starting to point down, just as the positive line is rising up, and crossing over the negative line.  What does that mean?

Simple... it means that the advancing move is losing momentum, but at the same time the positive di line is giving a bullishly cross over the negative di line.  This indicates that although the market itself is losing steam, the bears are too.  The di line (directional indicator) that is negative is the bears line.  When it rises the bears are starting to gaining power, but they also need the the adx line advance upwards too... showing that the momentum is also gaining power.

The-Chart-Pattern-Trader-spy-daily-02-21-2010

If you have one of the positive (green line) or negative (red line) di lines pointing up, then that line is in control.  So, if the positive line is above the negative line, then the market is in a bullish mode.  In the reverse, if the negative line is above the positive line, then the market is in a bearish mode.

Ok, now that seems simple enough, but where does the adx line come in?  The adx line simply shows the strength of whichever line is on top.  Any time the adx line starts to go down, then the market is losing power for the current trend.  Right now, we are seeing the adx line (black line) starting to point down, while the positive di line just crossed the negative di line.

So, even though the di lines had a bullish cross, that bullish move can't go too much further without the adx line rising up with it... giving the positive di line the strength it needs to rally up some more.  That leaves us in a sideways market until the adx line starts moving back up again, giving strength to whichever di line is point up at that time.

Hopefully that makes sense to you?  This means that the up move doesn't have much further to go next week, and that the down move can't happen until the adx line gains strength again by pointing up, at the same time the negative di line must also go up and crossover the positive line.

Just looking at the other indicators you would see how much the market is overbought.  But, it can remain overbought for much longer then you can believe it could.  It's the same thing on being oversold, as it could remain oversold longer then you might expect too.

It's all about how much strength (measured by the adx line) the market still has.  Once it loses strength, it doesn't have much further to go in that direction.  That why I'm expecting the market to be in a sideways mode next week, until the adx line cycles back down to the bottom and then gets ready for another momentum move... up or down?

This means I'm not expecting a big sell off on Monday, because there isn't as much momentum left (adx line) behind the move... in either direction.  Monday could pullback a little, or go up a little?  However, if adx line continues to roll back down, then I'd expect some profit taking by the middle of the week, but no big pullback.

A move down to the 1080-1085 level should be a good support level on any profit taking that should occur sometime this week.  This market will pullback, but it's not ready for the larger move down yet.  It appears that may not happen until the first week of March.  I still believe it's coming, because the monthly charts are clearly pointing down now.  They don't turn on a dime!  And, the weekly charts still putting in a bear flag.

The new larger trend is now down, but in the short term, we could chop around all next week, and really not go anywhere.  Here's a breakdown of where we are on each time frame...

  • Monthly Charts - Down Trend
  • Weekly Charts - Up Trend, but forming a Bear Flag
  • Daily Charts - Up Trend, but almost topped out.  Very Over Extended
  • 60 Minute Charts - Up Trend, but again... very over extended.
  • 15 Minute Charts - Sideways Trend, and extremely over extended.

With each chart in different trends, you can now see why I think we will chop around next week.  What we are waiting for is for all the trends to line back up in the same direction, along with the adx line bottoming... and ready to rise upward, giving fresh momentum to the trend in control.

Clearly, the monthly chart has the most power, and it's pointing down.  We need to wait for the weekly chart to line back up and start pointing down too.  Then the daily, 60 minute, and 15 minute chart would be the last to all line up.  If you can be patient enough for this too happen, then you can ride a really nice long trend down.

In the meantime, we will just have to take it one day at a time.  Let's see what Monday brings first, and go from there.  If we start to pullback at any time during this week, we should remember that fake print of 107.38 spy that occurred last week.  It could be the place that the market will bounce from?  We'll just try to remember that for when some profit taking does finally happens.

On a side note... the market seems a little strange here lately, almost like it's fight between the good and bad forces that control the market.  Maybe Obama is really trying to be the good guy here, and keep the crooked banksters from dumping their shares and crashing the market?  It's hard too tell about him, as he's clearly been a puppet for the banksters since they put him in office last year.

Is he finally taking a stand and supporting the America people instead of the crooked banksters?  I doubt it... it's probably just a political move since he and the Democratic party is losing popularity every day now (and election time is coming up later this year too).  Sorry, I still don't trust him or support him.  He's just as worthless as Bush was.  Just a puppet on a string, that's pulled by the Rockefellers, Rothschilds, Vanderbilts, and all the other familys in the Illuminati that run this world.

What most people don't understand is that the United States of America isn't broke... it's the Federal Reserve that's broke!  And they are a PRIVATE entity (bank) that owns a Private Corporation called "The United States of America Corporation".  The Federal Reserve is run by crooked banksters that want to keep all of the profit that they've stolen from American's and push off all the debts and liabilities onto the country of Americia (aka... the taxpapers).  Does that sound fair too you?

benjamin-fulford

If you like to listen to an audio by an insider named Benjamin Fulford by downloading this file (right click and save as).  If you would like to go to website, the link is here.  Scroll down the page to see Benjamin Fulford's link.  He also did some video's and they can be found here.

Many of this things haven't happened yet, which tells me that there is a fight between the good patriots of America and the crooked banksters.  Last weeks' weird action shows that something big is going to happen soon.  When is the big question?

Red

A Non-Event Day…

15

man-resting-in-a-hammock

It seems that the Fed's out-smarted the bears again, as the rate increase yesterday didn't affect the market at all today.  You could have just slept in, and you wouldn't have missed a thing.  It's funny how well they plan out every move they make, with such precision.  So what's the next move you ask?  The opposite of what you expect of course.

I'll try to piece this together for my weekend post, but I don't think the market is ready to rollover yet.  I'm looking for more of the same old grind sideways to up next week too.  Yes, I think we will rollover and take a breather first.  But after that, we are probably going to go a little higher.

Now keep in mind, I'm a bear by nature, but I'll trade both ways if required.  However, I'm really more interested in waiting for the next leg down to occur.  I really don't like to trade this choppy market as I just get beat up too much.  I'm a swing trader, not a day trader, and although some days I'm able to chat here frequently on the blog...other days I'm just too busy.  So if don't response immediately, it means I'm too busy that day, but I will get to your question when I can.

Not much else to add... it was a boring option expiration day pretty much.  Enjoy your weekend folks.  I certainly need too, as I've be slapped around all week by this big ugly bull.  Time for a nice rest now.  Come back late Sunday for more thoughts, predictions, and crystal ball rubbing.

Red

Fed’s Increase Rates…

80

bernanke-raises-rates

After hours the Fed released that they are increasing rates from .50 to .75, which caused a sell off to start and will most likely continue into tomorrow morning.  But, trading tomorrow will be risky if you are thinking that we will tank into the close.  That may not happen, as they aren't in the habit of giving you your money... they like to take it instead.

I fully expect the market makers to close it around 109-110 by the end of the day, as they don't want to lose money by paying out money to the option holders that have puts.  I'm expecting early morning selling, and then a grind back up to 110 by the end of the day.  The key time frame is 9:30 am to 11:00 am, and that should mark the low of the day tomorrow.

On another note, I was able to see a fake print of 107.38 spy on the 10 minute charts, which I added to yesterday's post.  This might be the place that they are planning to take the market to soon.  When, I don't know?  I don't think that will happen tomorrow, as we have too much support right now.  But, you should keep that target on your mind for when we do finally sell off.

So, tomorrow the key will be to watch for the selling volume to die off early in the morning, and get out of your shorts.  If we sell off to 107.38 tomorrow, I'd be shocked.  The market isn't ready to rollover yet folks.  We still need another week of choppy trading to set up a big bear flag on the weekly chart of the spy.  I do think we will put in the high for the market next week, before the large wave 3 down occurs.

As most of you know I make a really bad trade about a week ago and took a beating with some 106 puts I bought that will expire worthless tomorrow.  That's one of the reasons I try to think a little clearer this time.  So, knowing how manipulated this market is I fully expect the sell off tomorrow to be bought back up.  The news out tomorrow is the PPI and CPI... which you can guarantee will be positive.  That's the perfect way to raise rates (which the market won't like, and will be negative), is to add good news in with the bad news.

Timing is everything here folks, and they ain't stupid.  When they are really ready to tank this market, they will release nothing but bad news.  Right now they are still trying to hold the market up, so they will mix them together to have everyone's head spinning.

So, for the bears... you have a chance to save yourself tomorrow.  If we hit 107.38 (not likely), you had better bailout of all shorts!  The daily charts are still pointing up and won't rollover until next week.  I really think they want too go tag that 1127.38 gap (spx) that Sundancer pointed out.  I have the 112.00-112.50 spy area as major resistance, which is just a hair below the 1127.38 spx level.  I would estimate that to be about 113.00 on the spy, as it trades a little higher then the spx.  If anyone knows how to convert those two, please let me know.

Remember, nothing ever goes exactly as planned.  I'm getting better at this, but I make mistakes too.  Sundancer has again been of great help in informing us of the key levels that the market wants to go to.  There is also someone else I want to shout out a big Thank You too, and that's...

Anna over at Hot Option Babe (her free blog) and Options Black Board (her subscription service).  I have learned so much from her about the market, and how to trade options, that I wouldn't have made it this far without her.  She is a personal friend to me, as well as a mentor.  Yes folks, I do subscribe to some paid services, and her service is the best.  The banner I have on the right side of this page isn't a Google Ad... it's put there by me, because I highly recommend her service.

So, if you can't day trade, but would like to learn how to swing trade options... go sign up, as it's well worth your money.  Just take the trades that she does, and you will be happy that you did.  She is one of the best traders I know... seriously folks, no kidding aside.

Of course I can't post her trades here, as that information is for the subscriber only... I can tell you that she gets a large percentage of them correct.  I'm not going to claim a percentage on her behalf, but from my point of view, I'd estimate she's 75-85% correct on her calls.  Remember, that's what I see... and not what she's claiming.  On the one's she gets wrong, she more then makes up for those loss with profits from the others.

Moving on...

I'm torn on what to expect next week, as I see both bullish and bearish sides to the argument.  I think we should start to head down soon though, so I'll just try to piece that together on my weekend post.  Let's just get through tomorrow first... OK?

So, timing is everything tomorrow.  The support levels on the way down are at 110.35 (but we are already below that after hours), 109.60-109.70, then 109.00 for gap fill from 02/04.  After that is the 108.00-108.40 area, which is the gap from 02/16, and finally the 107.38 level.

I really don't think they will take it all the way down to 107.38 tomorrow, but it is possible.  If they do... again, get out of all shorts.  This market isn't ready to roll over yet.  Next week is a different story though.  The current pain is still at 109 tonight, and I will update you with that information should it change tomorrow morning.  I do believe they will close this market where it makes them the most profit.  Whether or not this current pain number is accurate or not, I don't know.  I suspect that the 110 level is the real number... not 109, but regardless of where it is, I'm not expecting a huge crash tomorrow.

Let's all try to stay in this game until we see what next week bring us.  I suspect they would like to close the month out good, and hit their key levels first... before tanking it.  Next week will bring a lot of whipsaw action as the bulls and bears fight it out.  I'm going to try and stay out of their way, what about you?

Red

The Bull Took A Breather Today…

1,757

resting-bull

This rally has been very powerful from the low at 104 last week.  Today the Bull took a breather before running higher again.  I don't think this rally is over yet as the daily charts are pointing up, and will probably remain so through all of next week, as they slowly top out and roll over into early March.  I do think we are due for a little pullback first... and then another move up.  How far?  I don't think it will be too far, or too easy next week.  In fact, I think it will be a chop fest, as they swing back and forth the whole week.

I don't know if they will get through the huge resistance area at 110.35-110.50, and the 200dma just a hair above that.  The next area of major resistance is 112.00-112.50, which I would love to see hit by next Friday, as that would be the absolute best place to go short for the expected fall into early March.  I'm not telling anyone to go long next week, expecting that level to be hit.  It's should be pretty wild next week, and the indexes aren't going to be safe for a swing trade.  Stick to stocks or something, if you must trade.

But for this week, since 108 is the current pain on the SPY, I suspect they will close it around that level by Friday.  That means I'm looking for a pullback tomorrow.  There is support at the 109 level, and it could hold until Friday, and that might be the close?   But, most Monday's are bullish, and that doesn't seem like it would be enough of a pullback before going higher.  That means they might take it on down to fill that gap around 108... which is the current pain level too.

The current pain level isn't always accurate on the indexes, but sometimes it is.  I find it more accurate on individual stocks, as they can push the price of stocks a lot easier then an index.  Pinning a stock at a certain level on opx is very common, as the market maker always want to maximize profits by paying out the least amount of money as possible.

The indexes are a little tougher to move and pin at a certain level.  That's why I wouldn't be surprised if it only pulls back to the 109 area tomorrow, and possibly Friday too.  However, the light volume makes it easy to move the market where you want it to stop.  If I had too guess, I'd say about 108.50 on the close Friday. 

The only thing that concerns me is the bull flag that formed today on the 60 minute chart (kinda looks like a bull flag?).  They could push it up (in the pre-market) through the resistance level of 110.35-110.50 and then send it back down taking out all the stop above key levels.  As I said above, I don't see a lot of downside between now and this Friday, because of the fact that the options expire this week.

So, I'm looking for about 108.50 by Friday, (and a choppy market next week).  Any lower would really surprise me.  The Bulls own this tape right now, and the ball is in their hands.  But next week will be a battle between the two, as they try to squeeze out both sides before they tank it the following week.

With this week, and next week's close of around the same area, we will then have a nice bear flag on the week chart, which sets us up for a nice fall the first week of March.  Nothing is for sure of course, as my bearish stance last week (and early this week) put a hurting on my account, and pride.  But, I'm still in the game... for today at least. 

🙂

Red

AFTERHOURS UPDATE:

Saved By Fed's...

Quick update here gang.  In case you haven't heard, the Fed raise rates from .50 to .75 points (http://www.marketwatch.com/story/fed-hikes-discount-rate-says-not-tightening-2010-02-18).  I'm expecting a lot selling tomorrow, so you bears might be saved.  Below is a screen shot of a fake print.  The target area is 107.38 spy.  I don't know if that's tomorrow, or if it happens over the next few days?  After that, we should bounce.  More later on my nightly post.

Here's the print, not showing the actual number in the upper left of the screen...

spy-fake-print

Here's the print with my mouse over the line, showing the close of the print in the upper left side of the screen.

spy-fake-print-with-low-target-shown

s2Member®