Not much to say here. Markets continue down without much of any bounce. At this point we just need to wait until the FP on the SPY is hit as that should be the bottom. If we continue down at this rate of speed we could hit the FP on Friday or Monday at the latest. My turn date of the 9th (+/- a day or so) is obviously going to be a bottom now and not at top as I previously thought might happen.
This also means that the low I was expecting toward the end of February could flip to a high instead. Not positive on that, but it's looking likely right now. That would then flip February from a rally month to a selloff month.
The recent mini-crash we had on August 24th, 2015, as forecasted in the movie Lucy on Scarlett Johansson's passport expiration date, and told here in the previous post 2 months before the event will be just a blip when compared to what is coming in 2016.
While I'm not positive on whether we have already topped already this year in 2015, or if we have one more slightly higher high coming in 2016, I will say with 100% confidence that we are in for another crash next year.
This coming week we have the Evil Reptilian Pope coming to visit the White House on September 22, 2015 (http://www.popefrancisvisit.com/schedule/arrival-in-washington-d-c/)... which I can't see as anything positive. This satan worshiping snake is surely making some kind of evil deal with our gangster run government leaders. What it is, I don't know? But it's clear to me that we are nearing the ending period for this stock market as when these people meet it's never good for us sheep. I'm not saying we are going to crash right after he meets but it's coming soon thereafter... like within a few months.
Over in China we have their government banning shorting their stock market back in July of this year (http://www.theguardian.com/world/2015/jul/09/china-bans-major-shareholders-from-selling-their-stakes-for-next-six-months), which spells disaster in my mind. When you don't let traders short the market you don't have any bears to squeeze, and that means you don't have any way to rally a market up from a sell off except for tricking the sheep into buying, and that's probably not possible after you scare them with a big drop.
Next to the sheep buying you have the big institutions buying the sell off, but they aren't dumb either and won't buy it without seeing some trapped shorts to squeeze... which of course gets the market going up big time as they all have to cover at a loss. This is exactly how over here in America our government has keep they market up as high as it's at now. Without shorts in the market to squeeze you will go "no bid" and just crash... and that is precisely what's been happening in China. And I don't think it's over with yet. When America crashes next year China will go down again.
There's your clues in the news that tell you the stage is set to crash in 2016!
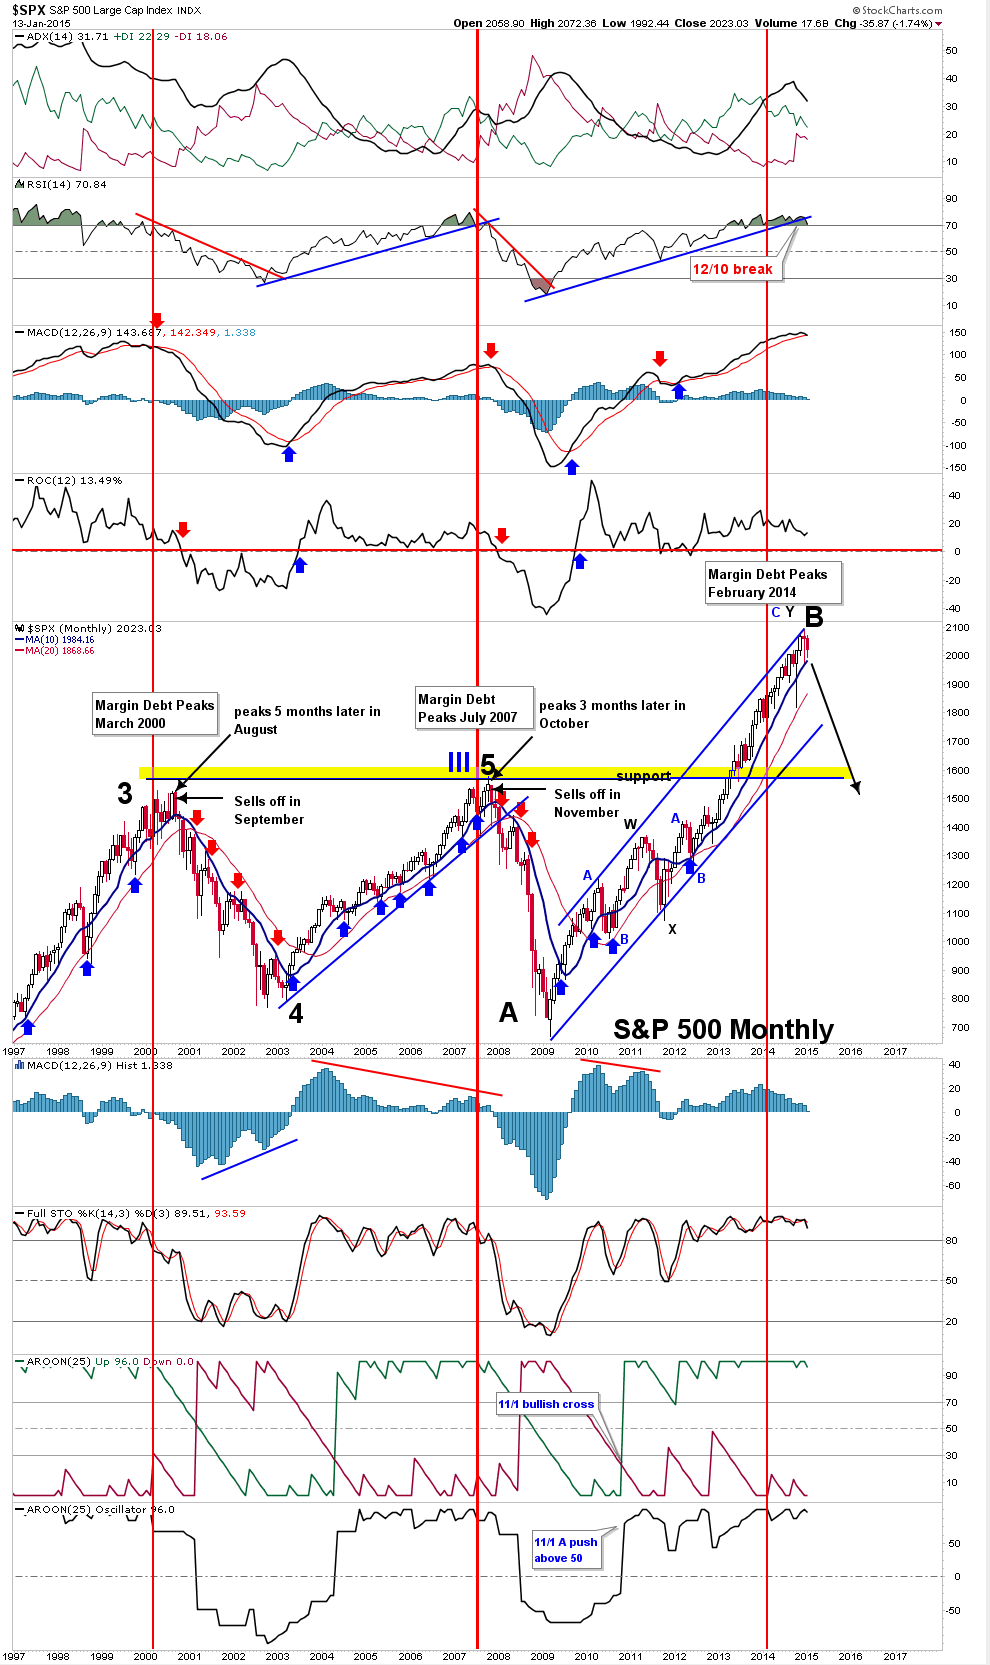
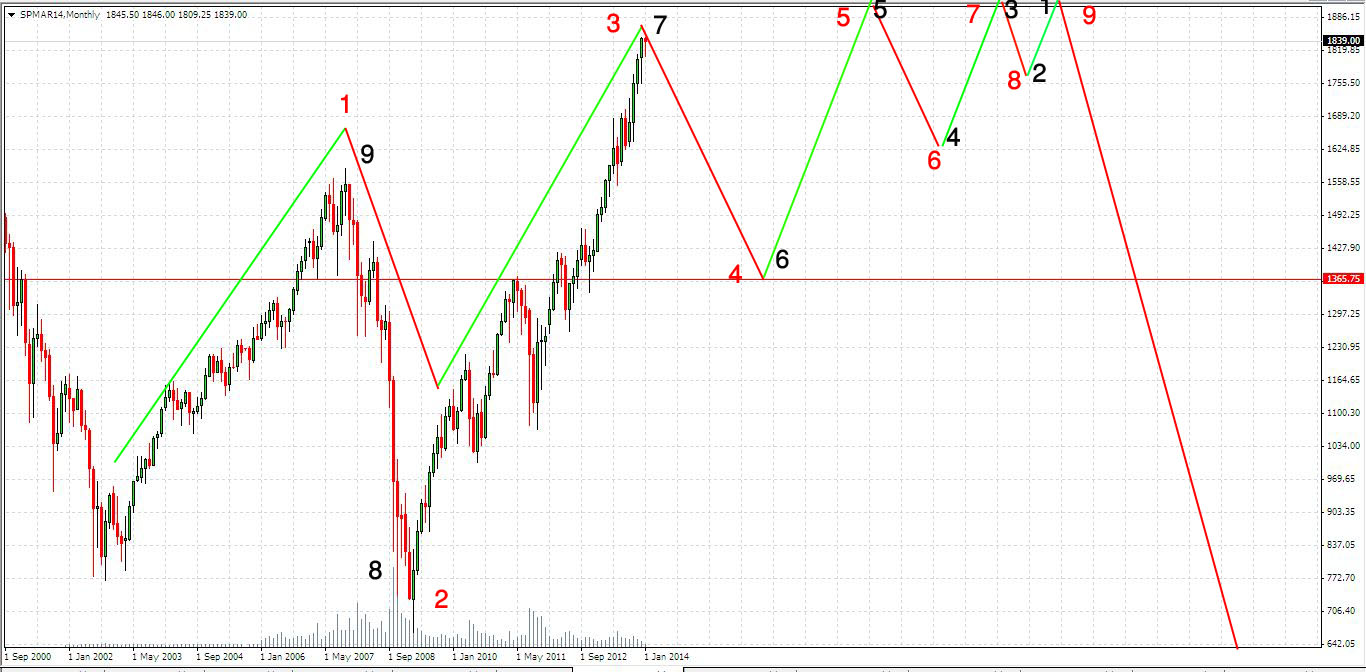
Looking at the technical picture we have the monthly chart now looking a lot like it did in 2000 and 2007 before it crashed the following year. The rising channel lines drawn on that chart point to about the 1820 area for the lower rising blue trendline to be support if this month of September were to go down further. So, we should expect that level to hold on a monthly close on it's first hit of that trendline.
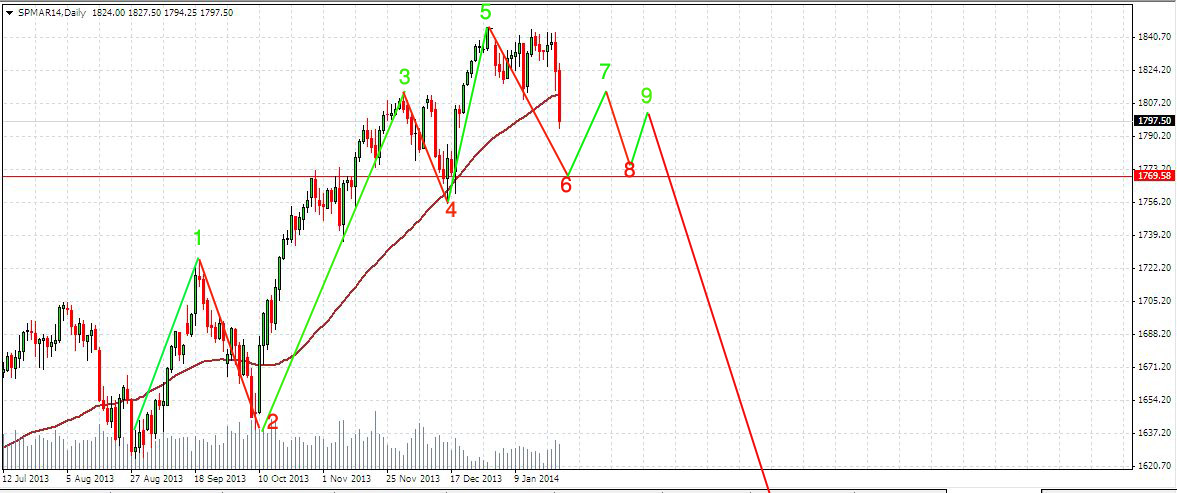
With the current down trendline being labeled Primary Wave 4 down by Tony Caldaro I'll continue to refer to it that way as well since his Elliotwave count seems to be the most accurate I've found. Not that I trade off of it on a day to day basis as I find it mostly helpful in seeing what's behind us and not too predictive for the futures due to it's many alternative wave counts.
However, on the bigger picture it's pretty good and looking forward. Basically we started Primary Wave 1 up from the 666 SPX low in March of 2009 and ended that wave in May, 2011 at 1370 SPX. Then Primary Wave 2 down happened into the 1074 low in October of 2011. Following that we had the super long Primary Wave 3 up that ended in May of 2015 at 2135 SPX. Currently we are in Primary Wave 4 down that should end around the first week of October, 2015.
Once it ends we will be starting Primary Wave 5 up, which should last 2-6 months, and may or may not make a new all time high. If it does make a new high then I'd expect it to last closer to 6 months and top out just above 2200 SPX. If it doesn't make a new high then I'd expect it to last closer to 2 months and would then be called a "truncated" Primary Wave 5... which is common and what I expect to happen.
Since I focus mostly on the technical analysis side of charting and not so much on the Elliotwave side I will say that from a TA side I don't see any new high coming and instead think we'll make a lower high on this Primary Wave 5 rally. In fact, I would not be surprised if they don't have some tricky big squeeze up for the month of October, peaking in early November for this final wave up.
That would then end the entire 5 wave series since the 2009 low and start the next cycle of waves down, that should erase 50%-80% of the entire market over the next couple of years. Should it only be 50% or so then we will likely stop and hold around the 1050-1100 SPX area where a rising trendline of support comes in at. It started at the 1974 low of 62, then the 1982 low of 101 SPX and connects to the 2009 low of 666 SPX. If that fails then we will find ourselves falling to another rising trendline from the 1929-1932 Stock Market crash low that connects to the 1942 low. That rising trendline is pointing to the low 400's on the SPX right now. Yeah, that's one scary low!
Of course we'll find support a the 2009 low of 666 first before it finally breaks and drops to the low 400's on the SPX, but that's too far out to predict right now. We only know that the evil gangsters who run the world want to create their insane New World Order where we sheep are even bigger slaves (and much poorer) then we already all. They want full control of every aspect of our lives, and crashing to the 1050-1100 SPX area doesn't seem too me to be deep enough to get the sheep into putting chips in their head or hands for the "Mark of the Beast" as foretold in the Bible.
But crashing to the low 400's on the SPX should would...
It would scare the sheep into giving up all their last freedoms to be saved from the severe poverty state that Satan's minions would put them into with a stock market wipeout like that! Naturally I don't want to see that happen, but I can't control it... I can only warn people that it is possible. It's possible from not only a charting point of view using technical analysis, but also from an "end times" model that we appear to be in right now... or at least those that rule the world think we are in.
Moving back to the short term I think we'll have a low in the market in the first week of October of this year. It should be a lower low then the recent 1867 SPX low on August 24th, but I'm not expecting something crazy like 1700 or so... like many others are forecasting due to the Shemitah September 28th date and the Blood Moon that happens too. I'm thinking in the low 1800 area for that bottom into early October.
Then we rally into mid to late October, topping out early November and dropping again the rest of that month with some bottom near the end of it and then the December Santa Claus rally starts until the first of 2016.
How low we go in November is not known yet?
Since Primary Wave 5 up should take 2-6 months I'd think we don't take out the expected Primary Wave 4 low around the low 1800's, but some massive squeeze up to 2100 SPX in October could change my mind? I'd rather see some steady 3 wave (ABC) pattern up to 2100 by the end of this year instead, because that would line up more inside the 2-6 months window for Primary Wave 5 up.
Doing the entire move in one month (October) would be very unusual and should then lead to a drop in November well below 1800 with the 1700's being the target zone. I personally don't think that will happen though, but I did want to point it out as "possible". Just visit this blog post daily to see new updated comments to stay up to date.
What would make more sense to happen is some low in the 1800 area early October or late September. Then start the A wave up for Primary Wave 5 up, that should top out mid to late October. Then down early in November for the B wave down inside Primary Wave 5 up, which should of course make a "higher low" then the start of the A wave up. Follow that by some C wave up in December to end the Primary Wave 5 up in early January, 2016 (or late December, 2015) that I think will hit 2100 area making a lower high then the Primary Wave 3 up all time high of 2135 in May of 2015.
While it's possible to make a new "higher high" for Primary Wave 5 up I just don't see it in the charts... from a technical point of view of course. The only thing that would make me believe we could see a "higher high" for Primary Wave 5 up is for the month of September to close above 2000 SPX, and I just don't think that will happen with the next 2 weeks being so bearish as seen in this chart below.
We just had the Fed's big September FOMC meeting where everyone expected them to raise interest rates and they announced that they wouldn't be doing that just yet. We sold off from that positive news, and that's not a good sign. If there was anything that should have been used to rally the market up to above 2100 by the end of September it would have been that good news.
Instead they did the announcement in the middle of September knowing very ware that the market would sell off after the news and drop lower into the end of the month. If they planned to extend this stock market higher into next year they would have made sure to give out some positive news near the end of this month to close it above it's 20 Month Moving Average... which is currently at 2000 SPX.
Here's a post done by Amateur Investor showing what happened in the past when the market makes 2 closes below the 20 Month MA.
Weekend Analysis
(9/5/15)
As I talked about last weekend there have only be "5" times since 1900 when the following conditions have been met.
1. Dow or S&P Composite dropped 10% in 5 Days or less.
2. Dow and S&P Composite were within 4 months of an "All Time High"
3. Shiller PE was 20 or above
4. The 20 Month Moving Average was tested.
Prior to the most recent event these conditions were met in January of 2008, April of 2000, August of 1998 and October of 1929. This month will be pivotal for the S&P 500 depending on whether it closes a 2nd Month in a row below its 20 Month Moving Average or not.
Let's see what happened with the prior "4" events and the 20 Month Moving Average. Starting with the last event in late 2007/early 2008 there were "2" monthly closes below the 20 Month MA in January and February of 2008. In this case the S&P 500 rallied back to its 20 Month MA which was then followed by another significant drop (points A to B).
The next case was in 2000 as the S&P 500 closed below its 20 Month MA "2" months in a row in November and December. Once again notice the S&P 500 rebounded back to its 20 Month MA before selling off again (points C to D).
Meanwhile in the Fall of 1998 notice the S&P 500 failed to close below its 20 Month MA in September and October although it did briefly drop below it two months in a row (point E). This was then followed by another significant rally through the Spring of 1999 (points E to F).
Finally the last event was in the Fall of 1929 as the S&P closed below its 20 Month MA in October and November. In this case the S&P rallied back to its 20 Month MA before another sharp sell off occurred (points F to G).
Currently the 20 Month MA in the S&P 500 is at 1999 sp this value won't change much over the next three weeks. Thus this will be a key level to watch by the end of the month and may have significant implications for the market in the future depending on whether the S&P 500 closes above or below it.
Clearly you can see that odds are very low that we'll make a higher high with Primary Wave 5 up when you have 2 monthly closes below the 20 Month MA... which I think we'll see by the end of this month.
To summarize, I'm looking for this week and next week to go down to make a lower low (then the 1867 SPX August 24th low) to complete Primary Wave 4 down. Then a rally into mid-late October for the first wave A up of Primary Wave 5... which should be somewhere in the 1950-2000 range I suspect. After that we should see a B wave down (inside Primary Wave 5 up) to lure in some more bears and scare the bulls out. This should NOT break the low of Primary Wave 4 down. Possible targets are 1850-1900 area. This should end in mid-late November. Finally we should have a C wave up (inside Primary Wave 5 up) that I suspect will reach around 2100 by the end of this year.
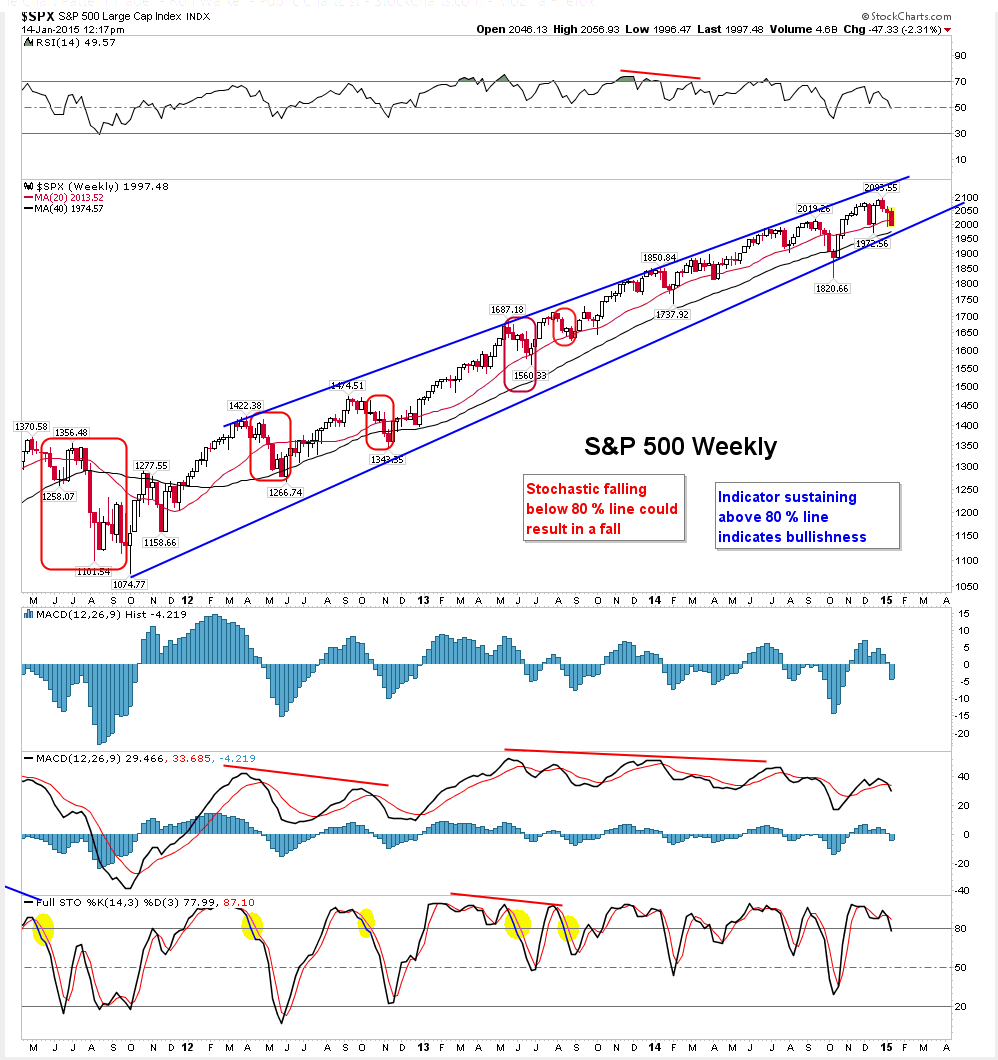
I'm losing my bearishness right now as the weekly chart is getting into oversold area where "turns" usually occur. Bears beware, we could see a new high coming soon.
July 29th, 2015 ... after the FOMC meeting Update
Well, the Fed's said nothing about a rate hike at today's FOMC meeting. So that rumor last week of a .35 rate increase in September was NOT confirmed yet. I suspect the retail traders will view this as positive and buy the market now. That tells me we will top out tomorrow or Friday instead.
I posted on the blog (in the comment section) the following after I did this newest video update...
"While I think we are "close" to having a breakout to a new high soon I just can't get excited about going long with the VIX so low and all those bulls still onboard from the 2040 SPX area over the last several months. If SkyNet would just flush them out with some drop to 2000-2020 I'd become a bull again.
They never filled the VIX gap at 16.60 and that leaves some hope that they might just be planing another drop to get the Weekly chart oversold and then allow for a bottom to form. All the bears would pile on below 2040 and once SkyNet gets the bus full it should be plenty of fuel to squeeze them up hard like the rip from the 1820 SPX low last year in October."
... and then this
"With the news from the FOMC today of them NOT announcing a scheduled rate hike in September as the rumor last week told us it would be .35% I have too think traders will get bullish now... and that should mean the opposite will happen and we'll drop again."
Finally I posted this...
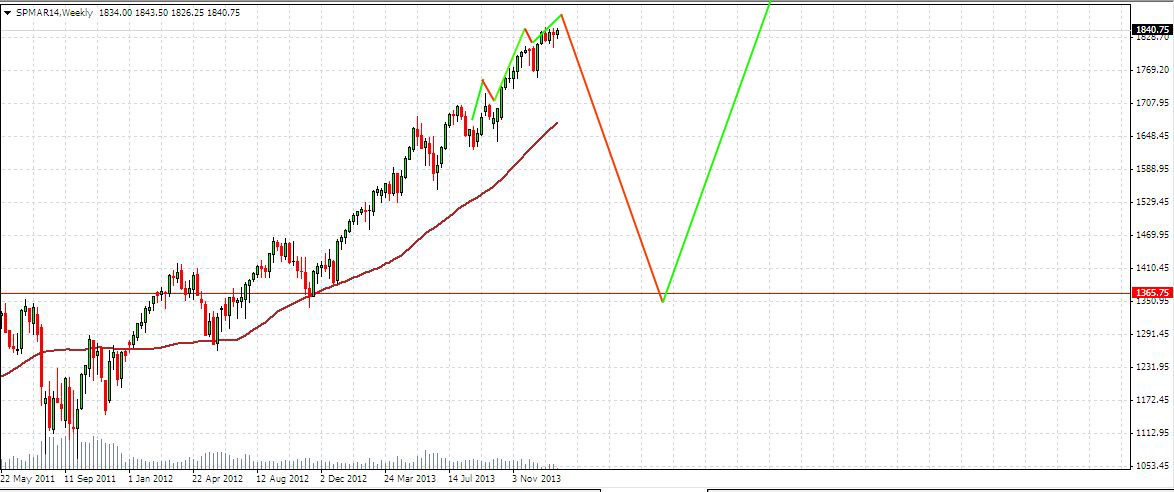
"Do "NOTE" that even though the weekly chart is turning back up slightly this move up needs to happen fast... like before breaking that rising trendline on the weekly chart. If for some reason we break that support (that goes back to the 1074 SPX low in 2011) we could fall off a cliff and bury the MACD's, Histogram Bars, and Stochastic's on both the daily and weekly chart."
My thoughts are simple... we are at a critical conjunction where the weekly chart can take us up to new highs with 2200 area being a real target zone, OR we can break the rising trendline of support from the 1074 SPX low in 2011 and drop like a rock. I just don't know which one yet?
However, with the VIX still very low and near the long time support zone of 12 or so I don't see the bulls having the strength to power on up through the current overhead resistance right now. That leads me to believe we are still in this choppy zone until either the downside 2040 SPX support zone breaks (and breaks the weekly support trendline) or takes out the 2135 all time high.
With that support trendline rising in price level every week now (it looks to be around 2080 now) this "zone" we are in will likely break one direction or the other this week or next week. If we close below that 2080 area this week then next week could be an "all down week" as mutual funds and hedge funds hit the "SELL" button due to the long time weekly support line breaking. Remember, "computer trading" looks for certain levels to hold or break and once one occurs BIG moves in one direction or the other just happens automatically. Humans aren't doing but about 30-40% of trading now as "algo's" make up 60-70% of all trading according to many estimates.
As we all know the Elite that run the world 100% control the "Main Stream Media" (MSM) and constantly mislead the sheep that watch TV, read the newspaper or listen to the radio. But what about the Internet? Do they control it fully too? NO is the answer as we sheep have the opportunity to publish our own thoughts on blogs like this or various social media outlets. However don't just assume that "they" are still busy spreading their "dis-information" stories throughout the Internet to dis-credit true and factual information as I'm 100% positive they are do that every day.
Remember, their entire "motto" of life is to do everything in their power to steal from you, poison you, lie to you, use you, and kill you off when you are no longer a profitable debt slave. So you should NEVER assume that even though they are bound to tell in advance of the things they plan to do to you that they will do it in a timely manner where you can profit from it... as the opposite is true.
While I think Lindsey Williams is probably a very good man and truly wants to help people I also think his elite source gives him information that is timed to benefit the elite by "suggesting" though his leaked messages that us sheep go long gold near the top, short the dollar near the bottom and of course miss the entire move down recently in oil.
Without a doubt if you traded from his information you would go broke!
Of course he clearly doesn't tell you to trade from what he tells you but we all know that people will still listen to his stories and base their trading around the trend that they expect to happen from his information. This would again result in losing you money as every thing he's told us over the last 5+ years hasn't been correct. The dollar hasn't crashed, gold hasn't went up strongly and oil... well he claims his elite contacts never caused the sharp move down as that was apparently all done by Obama trying to push Russia president Putin.
Well, regardless of whether or not the elite crashed oil or Obama we sheep never seen it coming and didn't profit from it... so the facts are still the same, "You can't trade off Lindsey's information (unless you do the opposite?)", as it's clearly been wrong since I've started to follow him. That's been 5-7 years now I guess.
Since I wasn't following him when he claims to have successfully told everyone in advance of the 2004-2008 big move up in oil and the fall back down hard into the 2009 low I can't know if that was timed out where the sheep could have profited from his information or not? I only know that since I've known about him his information has been wrong.
So how do you use this information if it's timed to get the sheep into the stock market on the wrong side when the prediction is expected to happen?
Simple really... you assume we'll be bottoming when this September, 2015 Stock Market Crash is forecasted and looking for a shorting opportunity several months in advance of it. When I look back at the 2011 mini-crash I notice that we had the most powerful crash wave (the wave 3 down) in August and then we had 1-2 months of a wild and crazy wave 4 up before the final wave 5 down to 1074 SPX early October low.
Clearly it was very tough to make any money on the wave 5 down as you would have be shaken out many times as the wave 4 up had so many ups and downs in it that most bears would have be puking their guts out from week to week waiting on that final leg down. The big money (and safer wave to ride) was being short from late July, 2011 into the early August low for the wave 3 down. This is the wave I personally want to catch (if possible?) and just pass on the expected wild ups and downs in September and October of 2015.
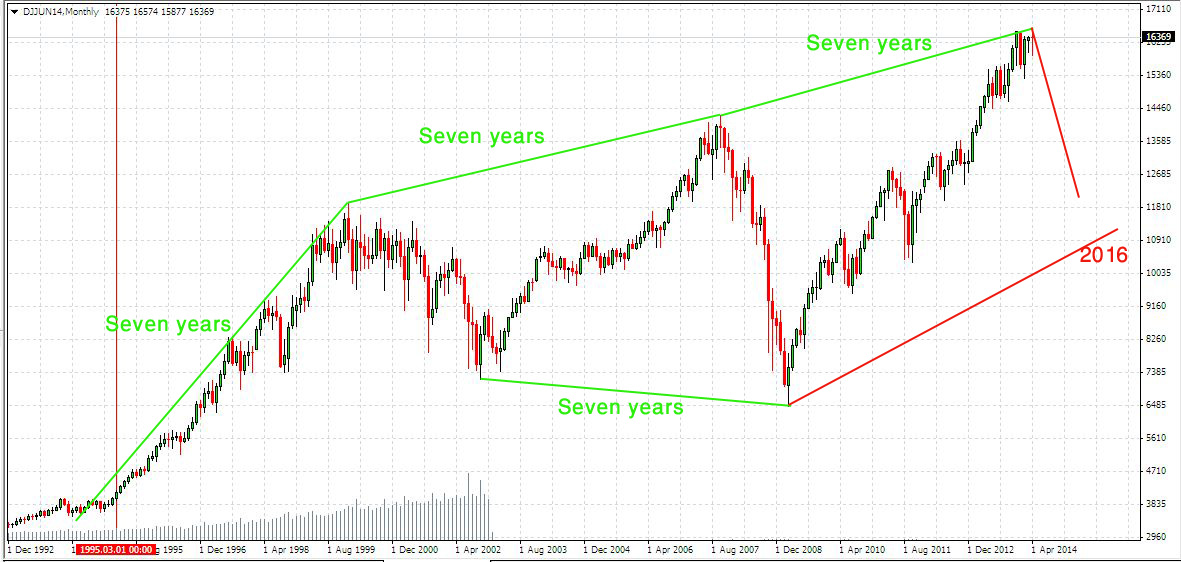
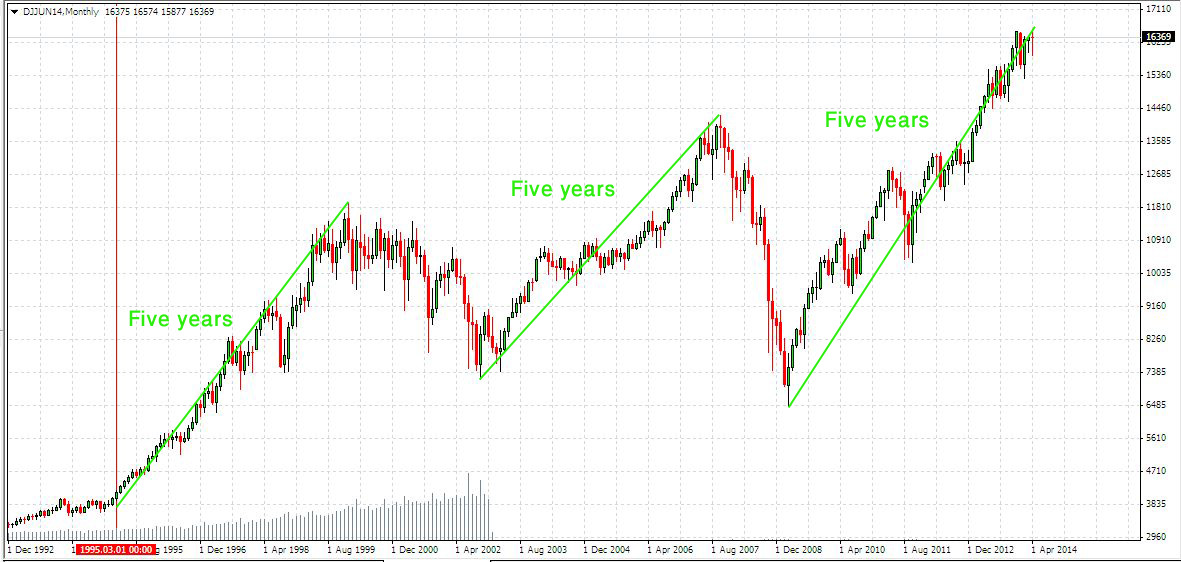
Past evidence on prior moves down is clearly shown in these charts of the DOW as explained in this video about "The Shemitah"...
I've looked a several other video's about The Shemitah and how it points to September 13th, 2015 as being the "Elul 29" and just like this one the best. It's done by someone named James Trivette, a preacher I guess? Anyway, I think it's well worth your time to watch.
Eclipses in 2015 March 20: Total solar eclipse April 4: Total lunar eclipse
September 13: Partial solar eclipse
September 28: Total lunar eclipse
Eclipses in 2016
March 9: Total solar eclipse
March 23: Penumbral lunar eclipse
September 1: Annular solar eclipse
September 16: penumbral lunar eclipse
My thoughts on this forecast again of something bad happening (like a stock market crash) in or around September 13th, 2015 are that it will be a bottoming period, so we should be looking to get short much sooner. When you ask? We'll as most of you long time follows of this site know all about Legatus I'll point out that we have a meeting this coming June 15th-17th, 2015 and coincidentally an FOMC meeting June 16th-17th as well.
That meeting is the one that many people are expecting the Fed's to tell the market that they will be raising interest rates in September of this year. While I don't know if they will state that news in that meeting I do believe that if they do say it we'll see a top in the market as traders will start bailing out long before the actual rate hike happens 3 months later. So by the time September comes the bulk of the panic should be over with... which again leads me to believe it will be a bottoming period.
This also tells me that we should have another big "Wave 3" down (the crash wave) somewhere before that September 13th "Shemitah"date and/or September "Interest Rate Hike". Past history tells us that August is a bad month for the market and if you look at 2011 you'll see that the biggest move down was indeed in August, not September.
Quite possibly we will top in mid-June and start the first waves 1 down and 2 up from there until late July where another big crash wave happens into August? Of course it shouldn't follow the 2011 pattern exactly as that would be too easy for us sheep to figure out... and you know "they" won't make it easy for us to profit from. If fact they will do everything in their power to make us lose all our money so they can take it from us as they profit wildly from the crash they created.
What about Legatus?
In that Legatus meeting I'm sure they will make the final decision on whether or not the "Stock Market Crash" is still on for 2015 or if they are going to push it out one more year into 2016. I don't know the answer of course but I do believe without a doubt that it will happen before Obama leaves office as they want to blame this whole crash on him. He will be the "scapegoat" for the coming collapse even though it was planned many decades ago.
These elite are just a bunch of crust old white vampires that will get a kick out of setting up the first black gay American president... which is why they put him in office in the first place I'm sure. I kind of feel sorry for him in some ways as it's not his fault for what's coming. But they seem to have NO Feeling at all of compassion for other humans and will do whatever it takes to fulfill their sick agenda.
I can't tell you the exact date of the top or the bottom (assuming the crash still happens) as I'm sure that any date I put out there will (could?) be off simply because I said it would happen. I'm just saying that if too many people (sheep only, as the elite know the date) discover the exact day the market will top then they will be forced to change it.
I remember back in 2013 when I did several posts saying that we'd top on May 22nd, 2013 because it was right in the middle of a Legatus meeting and a ritual "33" day (http://reddragonleo.com/2013/05/06/we-are-just-weeks-away-from-the-start-of-a-200-or-more-point-drop-in-the-spx). I told everyone about it for 2-3 months prior to it happening. I thought it would be the top for the year, and we'd crash from there into a low later that year. While it did top out and drop from 1687 SPX to 1560 by June 24th it wasn't the high of the year, nor was it a crash.
I don't know if they plans were changed or not (due to the fact that there could have been too many sheep aware of the date after I posted it?), but I've changed a lot since then in my charting analysis and simply post what I think is possible, but give NO promises of "it will be the top" or "we must crash"... as I now know how quickly "they" can change the plans to make us blog writers and stock market forecasters look like fools.
Therefore I'll just point out "possibilities" with some supporting evidence that whatever date or time frame I might a forecast for "could" be accurate. My personal trading method today is "day trading", and I've do very well with this method over the last year or so... much more profitable then trying to forecast which direction the market will be going at a week or two from now.
This is one of the main reasons I don't post as much anymore. The other reasons are that the better I get at day trading the less information I can find out there to post on that will be correct in the near future. There just isn't enough "darkside information" available that is accurate. Ritual numbers and ritual dates are too abundant to call everyone of them and expect a turn in the market.
So I just do my best to post comments on whatever the current blog post is, which are there to inform everyone of what I see short term for the market. Then I re-post via my twitter account. Sometimes (if I remember?) I post it on my facebook account too.
Why is Walmart closing stores around the county claims plumbing problems and then NOT filing for a plumbing permit?
There's a lot of posts around the internet talking about the mysterious closings of all these Walmart stores for some plumbing problems and then blacking out all their store windows and hiring police officers (not security guards as most stores would) to guard the place. Then on top of that are all these military vehicles being spotted going to these stores. Are they planning on marshall law in the near future to put the sheep in? If so, what event would cause this?
Walmart Closing Five Stores For 'Plumbing Problems'
I know we've seen of a lot this stuff before in the past and nothing ever became of it (at least in the "stock market crash" forecasting), but it's still worth knowing about as at some point in the future I'm sure they will do something bad to us sheep so they can put these Walmart stores to use locking up certain people that go crazy when the economy collapses and they have no job, no home, and no food to eat.
Whether all this happens in late 2015 or they push it out until 2016 is unknown, but I firmly believe it will start before Obama leaves office. If the Fed's decide to announce the future interest rate hike in September, 2015 during this coming June 16th-17th FOMC meeting then we should all expect it to start this year. If not, then possibly they decide to push it out one more year?
However, I certainly get the feeling that it will start this year... bottom in Sept/Oct and rally up into 2016 before they pull the rug out completely and slaughter this fat pig of a market. Let's face it... the monthly chart of the SPX looks eerily similar to the 2011 period before a nasty mini-crash happened.
What about any FP's? (fake prints)
I don't have any new ones (on the large scale) but I'm still thinking this old one from January 2014 "could" still be in play. It's one showing the NYA at 11334.65 high.
There's also the old TVIX FP showing 35.9599 from 11/14/2013...
So not much to say on that subject. Those prints could both be nothing as they are old and plans could have changed from then to now. But I wanted to include them should the market put in a top in mid-June and start crashing into September as they could be targets?
I'm still not sure all the pieces are in place for the total collapse though as the ECB is still supporting their markets in Europe with their version of Quantitative Easing and isn't scheduled to end until September of 2016 (https://www.ecb.europa.eu/press/pr/date/2015/html/pr150122_1.en.html). But, that doesn't mean we can't get started this year here in America and have the first larger "Wave 1" down, followed by a mufti-month "Wave 2" up into mid-2016. Then the "Super Crash Wave 3" down into the end of 2016 and probably some of 2017 could happen.
In both the 2000 and 2007 tops and crashes that followed we had a month chart that produced a wave 1 down and wave 2 up before their wave 3 "crash wave" down happen... therefore we should expect something similar to happen this time around as well. That gives us a strong possibility that it will indeed start in 2015 but get worse in 2016. So let's keep our minds sharp and open to the fact that we do have some very good odds of a major turn down this year.
Final Clues: Has the elite already warned us of "The Crash Date"?
As we go back to September of 2001 we remember the both the movie called "The Matrix", TV show called "The Lone Gunmen" and the famous episode of "The Simpsons" where we were told in advance of something BIG happening on 9/11. In the matrix it was shown on Neo's expiration date that said 9/11/2001. On the lone gunmen episode it was a hijacked plane that was on a collision course for the twin towers, and finally on the Simpsons it was the cover of a flyer that showed the twin towers in the background with a big $9 to the left of it for the cost of the pamphlet.
No one but the insiders knew what that all meant as I seriously doubt it if there was one "red pill taker" sheep that seen all three (or just one or two) of those messages and figured out the meaning before it happened. If so, he or she certainly didn't post it on the internet for all to see (not that many would have seen it anyway as youtube wasn't around back then).
So I'm not going to tell you what I've seen that points to another date of something really bad happening but instead tell you to think like the matrix and go watch a movie called "Lucy" with Scarlett Johansson and you'll see the date I think we're going to crash. Enough said...
Red
P.S. Interesting how VERY BEARISH the week after the June 15th-17th is, which is based on prior history.
Just more evidence of a very important week starting June 15th and ending on "Triple Witching" Friday the 19th...
But if so the next move up should be a huge one...
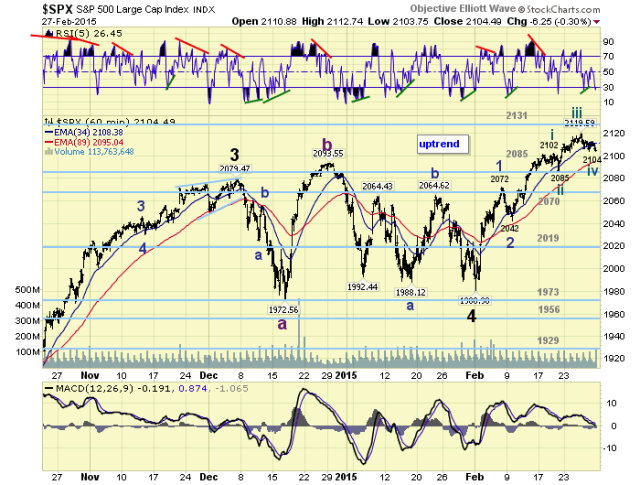
The market looks a lot like the pattern from November 26th to December 5th, 2014. It first sold off for a couple of day and then ran back up to make a higher high on the 5th right before a drop of about a 100 SPX points. This suggests we'll end the down move Monday/Tuesday (the 2085 area is good support) and go back up into the end of next week topping in the 2130-2140 area.
This pattern also happened on September 4th, 2014 to the real high in that area on the 19th. It topped on the 4th, sold off for a week and then back up to make a final higher high on the 19th before the real move down started. That one was around 200 SPX before bottoming.
We find a similar pattern (with a small twist) back on the July 7th high to the real high on the 24th. This time the market dropped again for 4 days first, then rallied back up to make "almost" a double top, but failed and had a big "one day" drop on the 17th before it then ran up again into the 24th for the real "higher high" just before the 87 point drop followed.
Looking back even further in time I can see this pattern showing up many times with slight twists to it. Sometimes it did it's first drop for 2-3 days, then back up to a new high and other times it took over a week for the first drop to end. And some of the times there were 2 short drops before the final higher high with the real big drop that followed.
However, there were a few "fake outs" where it appeared that pattern was going to happen but it didn't. The October 30th, 2013 to November 7th was one such fake out. It did another fake out shortly afterwards on November 29th to December 9th, 2013 where each time the expected "big" down move to follow never happened.
The November 7th high was followed by a big bear squeeze for several weeks. The December 9th high did produce a few days of selling but it never dropped big like all the other periods where 80-120 points down usually followed. That drop from the 9th barely took out the first low that hit on the 4th of December.
After the move up first I'd look for about 2060-2070 area to be retested as that was a triple top area before the breakout...
It should last about 2 weeks I'd guess and then back up to start a huge wave 3 rally of some kind. Looking back again at the weekly chart and that rising trendline from the 2011 low of 1074 SPX I would expect it to hold again should they break through that triple top zone. The 20MA on it is at 2042 right now and the 40MA is at 2003... which is resting just about on that rising trendline.
If I had to guess I'd say that 3 weeks from now the trendline should be around 2030-2040, but with February having such a strong rally I'm not sure how far down they will allow the market to drop in March, but if they drop that far it should be over with by the 3rd week and allow a rally to start in the last week to recover most of the down move.
This was a twitter comment I read last week and if it's a "factual" statement then any early down move in March has high odds of being erased by the end of March.
"Since 1950 the SPX has gained >5% in February only 5 times (1970, 1975, 1986, 1991, 1998). Added to gains in March all 5 times."
On an "elliottwave" count I think we are in some type of smaller wave 4 down now, that should complete on Monday or Tuesday. Then a final smaller wave 5 up to about 2130 area to end a larger wave 3 up (that started at the 2042 low). This would then complete a 5 wave pattern up from that 2042 low to an estimated 2130 area high.
Assuming this larger wave 3 up ends up being around 90 points in length it the following larger wave 4 down should be some Fibonacci level of 38.2% or even 50% in depth. If that count is right then it doesn't look too good for the 80-120 points move happening that I'm thinking will occur. So for that reason I do think that this chart from Tony Caldaro will be relabeled should my technical analysis be correct by seeing a back test of the triple top area in the 2060-2070 area (or Tony says it's an "acceptable" pullback to still qualify as a wave 4?)
While I like to read what others have as wave counts using EW I just don't find it very accurate on the short term. The gangsters that run this market don't play by EW rules as we all should know by now. Try to make sense of that straight up rally from the 1972 low in December 2014 to the 2093 high and give me your EW count there? Can't be done in my opinion.
Don't get me wrong, I like Tony and find his posts helpful a lot. But SkyNet (what I call the super computer that manipulates the market) is programmed to steal your money. So it's well aware of bloggers (and traders) that use technical analysis, elliottwave, fib. levels, astrology, T cycles, etc... to predict the future direction.
Which of course mean...
It's going to fool you by letting these charting methods work for awhile and just when you think you've figured it all out SkyNet just pulls a 180 on your wave count (and/or TA's, Fib. Level's, etc...) and has some crazy move out of the blue that no one can see coming. The move up from the 1820 SPX low to the 2079 high is a perfect example.
I read many tweets about it and hear people say that they'd never seen such a move in their 40 years of trading! And other stating that it had never happened before in the past! This should tell you that the more us sheep have access to various charting methods that used too work before the internet the more likely we are to see "Crazy Ivan" type moves happen as SkyNet has to adapt to us sheep figuring out the next move and being on the right side of the trade for once.
Since SkyNet can't steal the sheep's money and give it to the bankster gangsters that programed it the computer is forced to go hard in one direction or the other to hit all the buy and/or sell stops put in place by the sheep. What I'm saying here is that a typical wave 4 down should be around the same length as the wave 2 was (2072 down to 2041 on 2/9), and some smaller Fibonacci level like 23.6% or 38.2% as opposed to 50%-61.8% that I'd need for my thoughts of dropping back to that triple top area.
Regardless of the EW count I'm still leaning toward my forecast of a dip to 2085 area Monday/Tuesday, up to 2130 area and then down to 2060-2070 zone to retest the breakout point that has taken us up to the current new highs. That's my forecast for now and I'm sticking too it! LOL.
Red
P.S. I installed a new commenting system so now you can use Disqus, WordPress, Facebook, or Google Plus to leave your thoughts on the market. I'll set it to default to show the Disqus comments as that's what I've had on the blog since I started it in late 2009. Unfortunately you'll have to click on each of the 4 icons to read (or leave) comments using each of them as it does not combine them all together. There could be some comments under each one so click on all of them to see what's going on... Thanks.
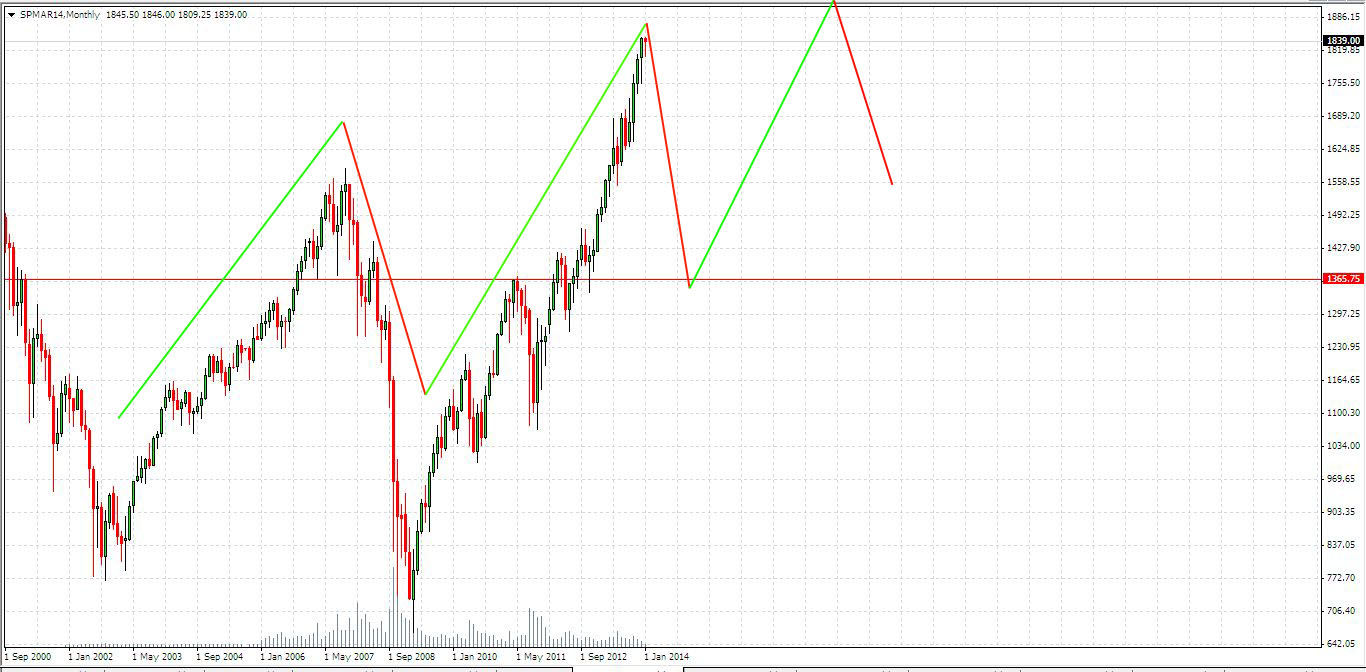
I guess if the correction is fast enough you might call it a mini-crash, but the next BIG Crash is still a couple of years off I believe. I'm looking for an early pullback in January/February and then a push back up into mid-summer, with July being the most likely month to top out in. What I'm looking for is a move similar to the 2011 drop that bottomed at 1101.54 SPX on August 8th, then bounced and made another lower low on October 3rd of 1074.77 which most elliottwave chartists call "Primary Wave 2" down with the current rally up since then being one very long Primary Wave 3 up.
So we are looking for a Primary Wave 4 down this year and it should be 20%+ if it's going to be similar to P2 down. This monthly chart tells us a lot from a technical point of view. We can clearly see the MACD's losing momentum and looking ready to go negative soon. How long it takes is just a guess but I think we'll have at least one month close down (probably this January) and then a few positive months into mid-summer before losing the zero line on that MACD chart. Possibly we tread along it for the first half of 2015 staying between zero and maybe +5 or so?
Looking at the rising channel we can see that lower blue line is coming in around 1750 which I believe we could very well see hit later this year. While it's possible that it breaks and we go down and hit the horizontal support level just under 1600 from the two prior tops in 2000 and 2007 I suspect they won't let it drop that far. Remember, there is very likely one more very larger "blow off top" rally coming (Primary Wave 5) that should top out in 2017 sometime... so I don't think they'll let the market collapse too far this year.
Medium Term Outlook
Clearly we have already started selling off this January as I write this post so that's no big surprise. Looking at the weekly chart we the MACD's going negative and price level still inside the rising wedge. Back in October of 2014 we seen the market breakdown through that lower trendline of support but rally back above it before the week closed out... saving the market once again from a much bigger collapse.
We notice now that the MA 40 is around 1974 on the SPX in this chart and that's just slightly above that lower support line on the rising wedge. So, if they plan on rallying up to new higher highs into mid-summer they need to hold that zone on a weekly close to avoid a bigger drop. However, the monthly chart looks much weaker this time around then back in October when they pierced it once, which leads me to speculate that the support line won't hold this time if it's broken. My guess is that we'll hold it on the first hit, then lose it later this month or early February after riding the support for a few weeks.
By letting the trendline break with a deeper correction they can then have a more sustainable up move afterwards. It would create a new channel and level of support for the bulls and give them the opportunity to rally into mid-summer to backtest the broken trendline on the current rising wedge, which would of course be at a much higher level by then.
This is the best scenario for the bulls I think as without a decent correction I just don't think they will be able to rally up to 2100-2200 like they want to do. Trying to stay inside that rising wedge all the way out to mid-summer (where I suspect we'll top at) will be a tough feat for the bulls... especially with the threat that Janet Yellen will speak of a future interest rate rising happening in the near future. While I don't know if they will actually raise it this year just the hint of it will be enough to scare the bulls and excite the bears.
As we all know the market rallies and sells off in front of any planned events and not when they actually happen. It's the old "sell the rumor, buy the news" saying that keeps the market always doing something today in anticipation of something in the future. This is why the market is always on edge every time the FED's release the minutes of the latest FOMC meetings.
So from a technical point of view, combined with the fear of some future interest rate hike, it won't be likely that the market can continue rising until mid-summer while staying inside that wedge. It's getting too bearish on the monthly chart now to support the weekly holding that lower support trendline. This is why I think it will break this time around and then rally back up later this year for the possible backtest.
The monthly chart has support from the MA 20 at 1868 area, which "could" be the zone that we'll see this January, February, or March before turning back up to rally hard looking for that higher high into mid-summer. If they don't allow the market to correct that far and instead manipulate it to stay inside the rising wedge on the weekly chart then I don't think we'll see much of a higher high into mid-summer. At that point I'll lower the odds of seeing 2200+ and forecast that we'll end somewhere in the 2100 area with a lot of sideways range bound trading between now and that top.
On the flip side if they allow the deeper correction then I'd expect to see 2200+ in mid-summer with a more steady rally happening along the way as opposed to the range bound wild swings up and down we've been having over the last several months. While this range is over a 100 points wide right now I think it will end if they just allow a bigger correction to happen... as therefore a more powerful rally can start. Failure to allow the correction means we'll likely see more of these wild and crazy moves up and down until summer while they try to stay inside that rising wedge.
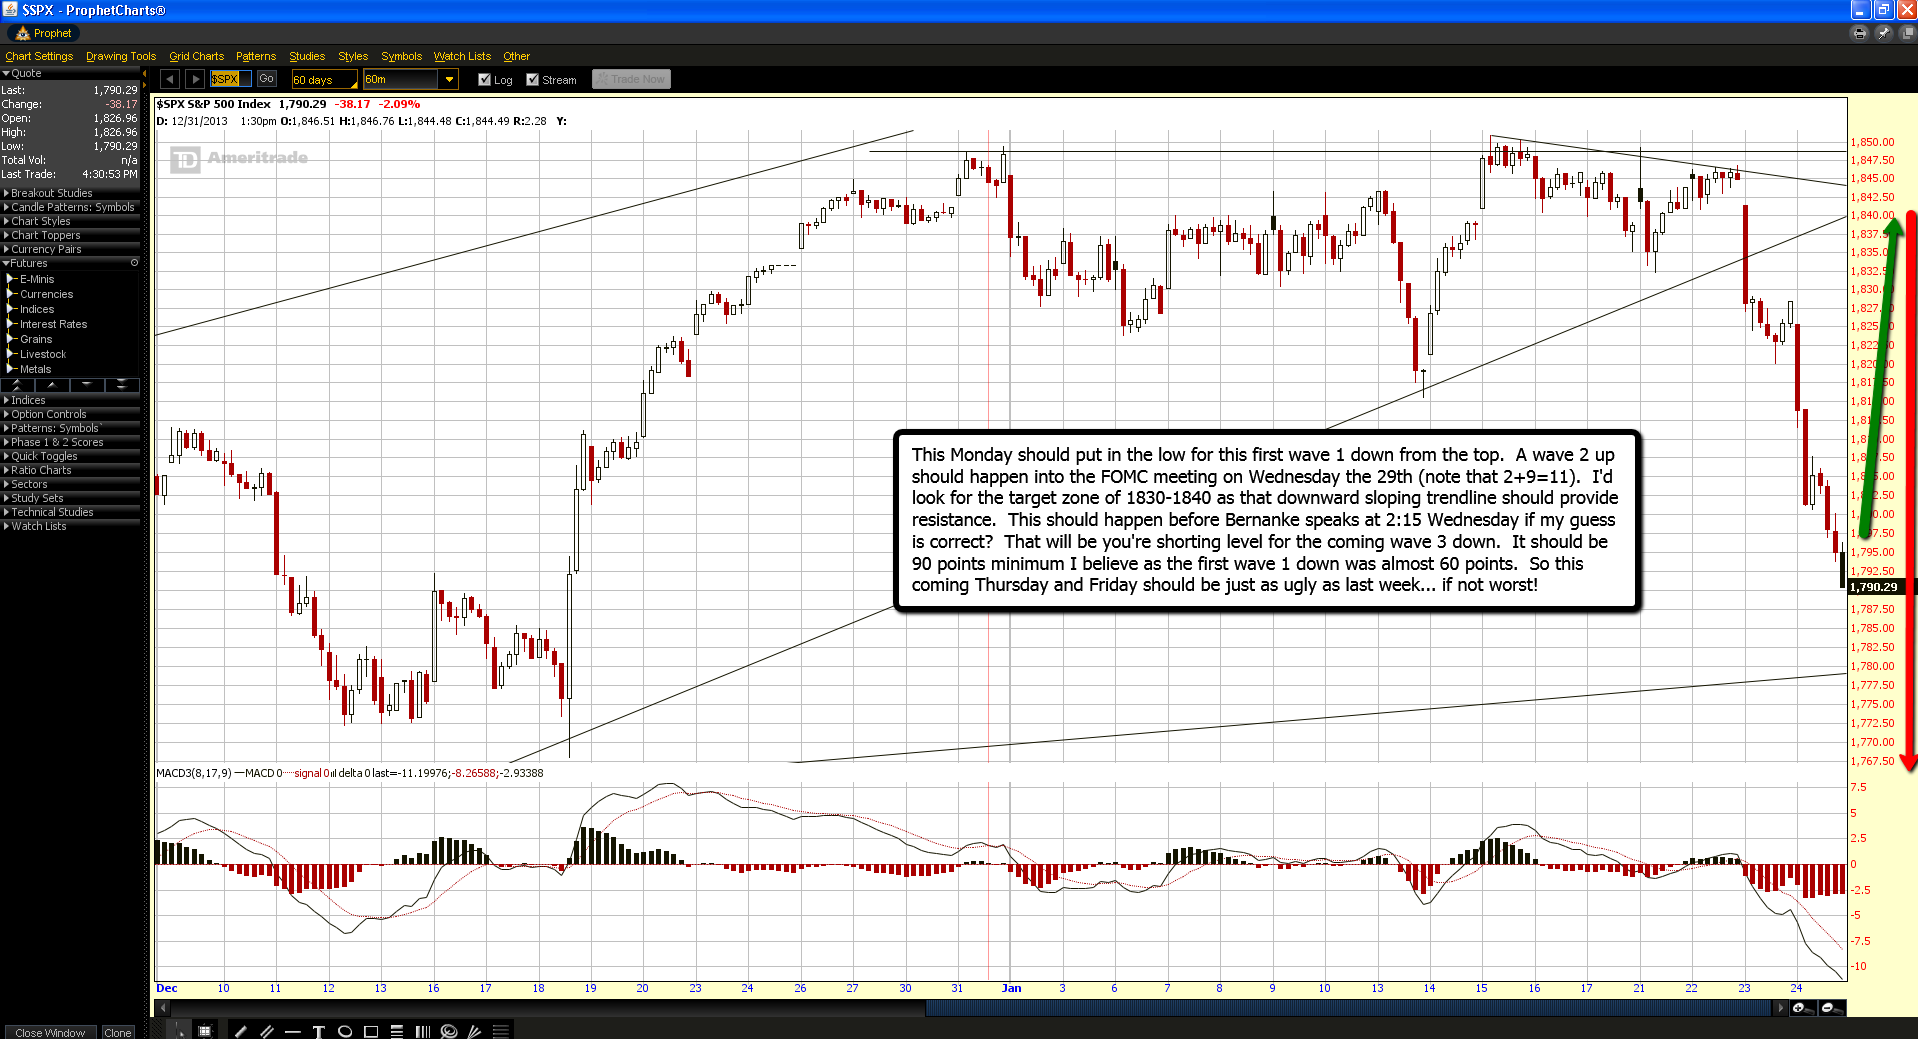
Short Term
While it's been a very steady and controlled move down this week the daily chart is getting oversold and due for a bigger rally here soon then the one day (or intraday) moves we've recently had. The short term support is at the 200 day moving average around 1965, which could be hit this week if they are going to do a "flush out" move before bouncing. It lines up nicely with a double bottom area of 1972 from December 16th, 2014 which should add to the support as well. It's an obvious level that everyone see's and is currently acting like a magnet for the market, drawing it closer every day it seems.
However, we all know that when something it very well seen by the masses SkyNet will usually do the opposite so the sheep lose money again. So that "flush out" move to that zone should be tricky and fool the sheep so they get shaken out of their positions at a lost. How will SkyNet do it? That's a great question and one that I can't answer unfortunately.
It could gap down to that zone Thursday morning and reverse back up all day squeezing the bears that are expecting a crash, and continue that squeeze into Friday recovering a large amount of the move down, while making all those bears holding January 16th puts expire worthless and futures traders start buying back their shorts at a lost (which is how the bulls get these huge rallies in the first place).
Or they could just rally it up from the current level staying above that obvious target zone and pushing that thrust move down until next week or the week after. I'm thinking (guessing... speculating) that a nasty solid (or almost solid) red candle bar close on the weekly chart for this week isn't something they want to happen as it will then increase the odds of the following week tanking even deeper and breaking the 40 MA around 1974 on the weekly chart. Some how I get the feeling they will start a squeeze from the current levels (falling short of hitting the 200 DMA of 1965 and/or the double bottom of 1972) and save the move down lower for next week and/or the week after.
I think the 200 DMA will not be the short term bottom before a bigger bounce. It doesn't line up to me. I see SkyNet fooling the sheep with a break of that zone to a lower level. While I'm sure there will be a bounce from it as the big boys buy it I don't think it will hold as the low for them to rally up to new all time highs from. I think that we'll see a short lived bounce and then another push lower into the end of this month.
I'm guessing will bottom around the next Legatus meeting January 29th-31st, 2015... which also is the same time frame of another FOMC meeting (http://www.federalreserve.gov/monetarypolicy/fomccalendars.htm). Too much coincidence for me to think a big turn in the market won't happen during that time period. Therefore I think we'll bounce this week and hold the 40 MA on the weekly and the lower rising trendline on that rising wedge, and then over the next 2 weeks into the end of January we'll see a break of that line with a target zone of 1750, 1820, or 1868 being hit.
The 1750 estimate is from the monthly chart as that's where the lower trendline is on the rising channel. I give it low odds of hitting but it's still possible. The 1820 area is from the October 15th, 2014 low and would be of course create a double bottom. I give it medium odds of being hit. The 1868 level is from the 20 MA on the monthly chart and it makes the most sense too me of being hit due to the expected turn date zone of being at the end of this month.
It would also fool a lot of sheep that (once at that zone level) would naturally be staying short expecting to exit and go long at the double bottom of 1820... which brings us back to the current market level today as being in a similar zone of just 20-40 points shy of another expected double bottom where the sheep would again want to exit their shorts and go long. Since SkyNet's job is to steal the money from the sheep I find it unlike to be hit this week as I previously suggested.
It's all about mis-direction as you know. Anything too obvious to happen simply won't happen... at least not when everyone is expecting it to happen. Therefore I'm looking to be fooled as that's SkyNet's only way to profit... and it does it very well. After we rally up next week to get everyone bullish again we'll be looking for the sell off to continue into the Legatus/FOMC date zone.
Here’s the previous notes that I posted back in January…
2014 will be a magic year (meaning what? will you pull a rabbit out your hat? will you steal money from the sheep without them seeing you do it?)
100th anniversary of the first world war in 1914 (strangely when I researched what happened to the DOW back then it was closed down for several months due to the first world war starting. are we expecting the same here? REFERENCE: http://www.ritholtz.com/blog/2013/02/most-long-term-charts-of-djia-are-wrong, http://measuringworth.com/DJA, https://www.globalfinancialdata.com/gfdblog/?p=1426 )
70th anniversary of the Bretton Woods Conference that gave birth to the IMF. (The delegates deliberated during 1–22 July 1944, and signed the Agreement on its final day. REFERENCE: https://www.google.com/search?q=first+bretton+woods+conference+date&ie=utf-8&oe=utf-8&aq=t&rls=org.mozilla:en-US:official&client=firefox-a&channel=fflb Not sure what the hidden message was here?)
25th anniversary of the fall of the Berlin wall (Destruction date: November 9, 1989… but what is she hinting at here? Is the “buzz word” the “25th”or the “fall”? Does the 25th mean a certain future date or does the word “fall” indicate that the market will fall hard?)
7th anniversary of the financial market jitters. (again with the focus on the number 7… meaning what? are we looking for another move down similar to 2008?)
The crisis still lingers… (clearly this means we are going down again)
It will not happen randomly… (of course not, it’s always planned)
“Global growth is still stuck in low gear” (Hmmm… just a fall guy to blame I guess? We tank and it’s the fault of slowing global growth)
It will not be without downside risks, and significant ones (referring to inflation… or was it really meant to refer to the stock market?)
We are seeing rising risks of deflation… (good for us sheep but bad for them)
Global growth slowing down as the economy cycle turns… (the “buzz word” that stands out to me there is “cycle turns”)
Risk of capital runs… (You really mean the gangsters are moving their money out the market before the collapse)
Dry run back in May of 2013… (Ah yes, the old test where Bernanke hinted at pulling money out the market last year)
There could still be some rough waters ahead of us… (another clear warning that they plan on taking the market down)
Overall, the direction is positive (meaning after the downturn the market we’ll go back up again, which should be a final Primary Wave 5 up with this coming correction next month being a nasty Primary Wave 4 down)
95% of the income growth went to the top 1% (Duh… nothing new there as that was always the plan! Steal from the sheep and give to the wolves)
Tapering will have too be very well timed… (again, she’s clearly staying that we are going to withdraw money from the market)
Central banks will have to “undo” what they’ve done… (and again, more references to cutting back the stimulus?)
Removing the threat of the debt ceiling… (meaning what? They won’t set one, or make it unlimited? I don’t know what she means with this sentence?)
A stress test will be done in 2014… (Why? You already know the banks would all fail. I guess they have to blame the correction on something)
I give the odds of a big correction at 95% and a full blown crash of about 50% for 2014...
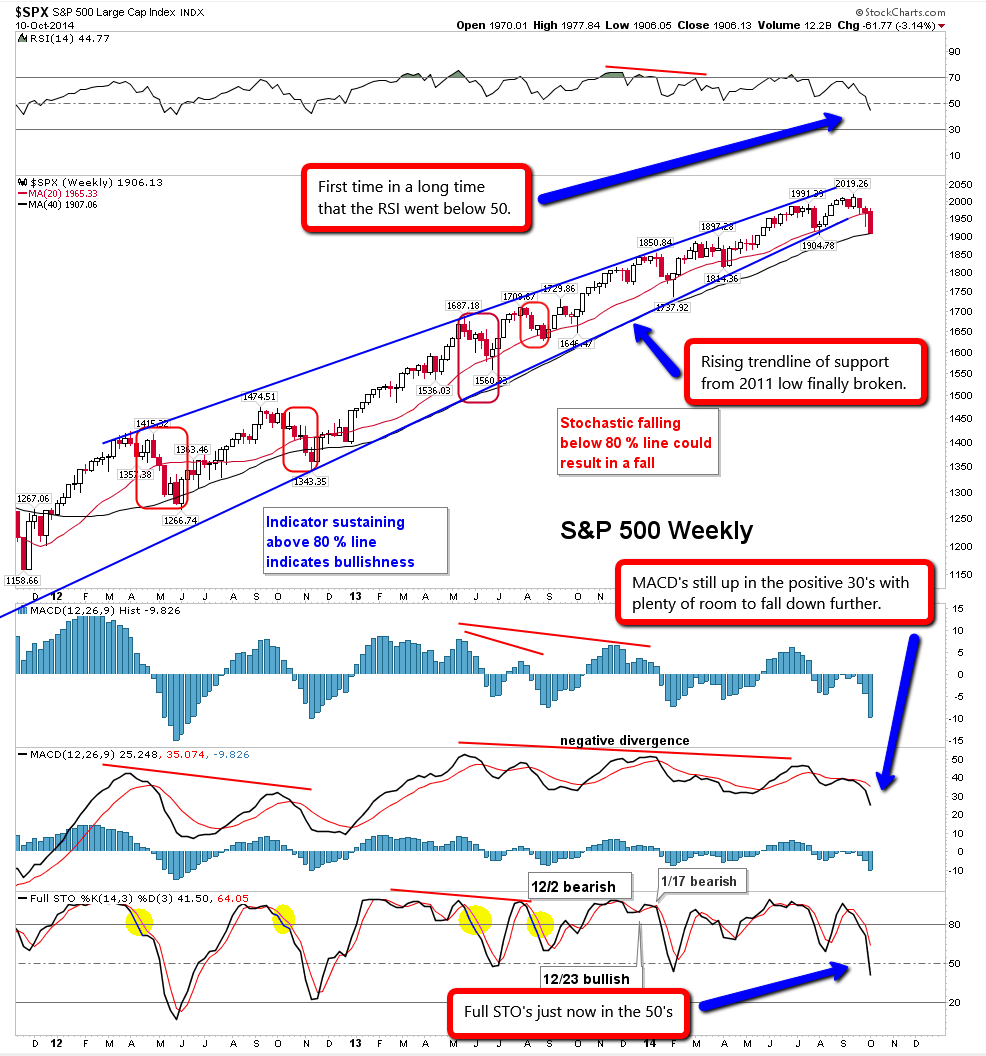
In the past 3 years all we've seen are these small 4-6% corrections and many people think that's all we are going to have this time around too. They see the market at or near the 200dma and think it will bounce and go back up to new all time highs again. But will this time be different? I think so. Why you ask? One simple answer: "The weekly rising trendline of support final broke down last week and closed below it".
It's been having these small corrections since the 2011 low and bouncing off of that trendline every single time. It's been great support for the last 3 years but it's finally failed. This is the first signs of the end for the bull market since the 2009 low. While I'm sure there will be one more final rally to retest the current high, (which should start this December, 2014 and carry into early 2015) the current trend is down and we should not assume that this correction has ended yet.
My estimate is that we'll see the mid-1700's on SPX by the end of November before the Christmas rally begins. I suspect the Full Stochastic will be bottomed in the 20's on the chart above by that time and allow a relief rally. The MACD's should be close to the zero line as well, where other bottoms form and allow a bounce. Once that rally starts it should last all of December (of course) and carry into the early part of 2015.
It's hard too know how long the rally will last as it could be only 3-4 months or 3 years? It is called a Primary Wave 5 up in Elliottwave terms by others (Tony Caldaro) that do a lot better job of tracking wave then I do. It only has to have a higher high then the current high of 2019 SPX to be a successful Primary Wave 5 up. It could simply go to 2020 in 3-4 months or extend for 3 years to 3000 or more? There is no way to know what the government will do to try and extend the market but we can speculate based on the past.
What could cause an extend Primary Wave 5 up... QE4, QE5, and QE6?
I don't know the answer there but I'll say that "in my opinion" the QE programs have exhausted themselves and won't work to prop up the pig from here on forward. This pig of a stock market is much too heavy now with unsustainable debts world wide. It's like giving a dying patient a fourth, fifth and sixth round of chemo and radiation treatments with triple the morphine. It might have helped keep the pig alive in 2009 but this pig is dying and no amount of stimulus is likely to work this time around.
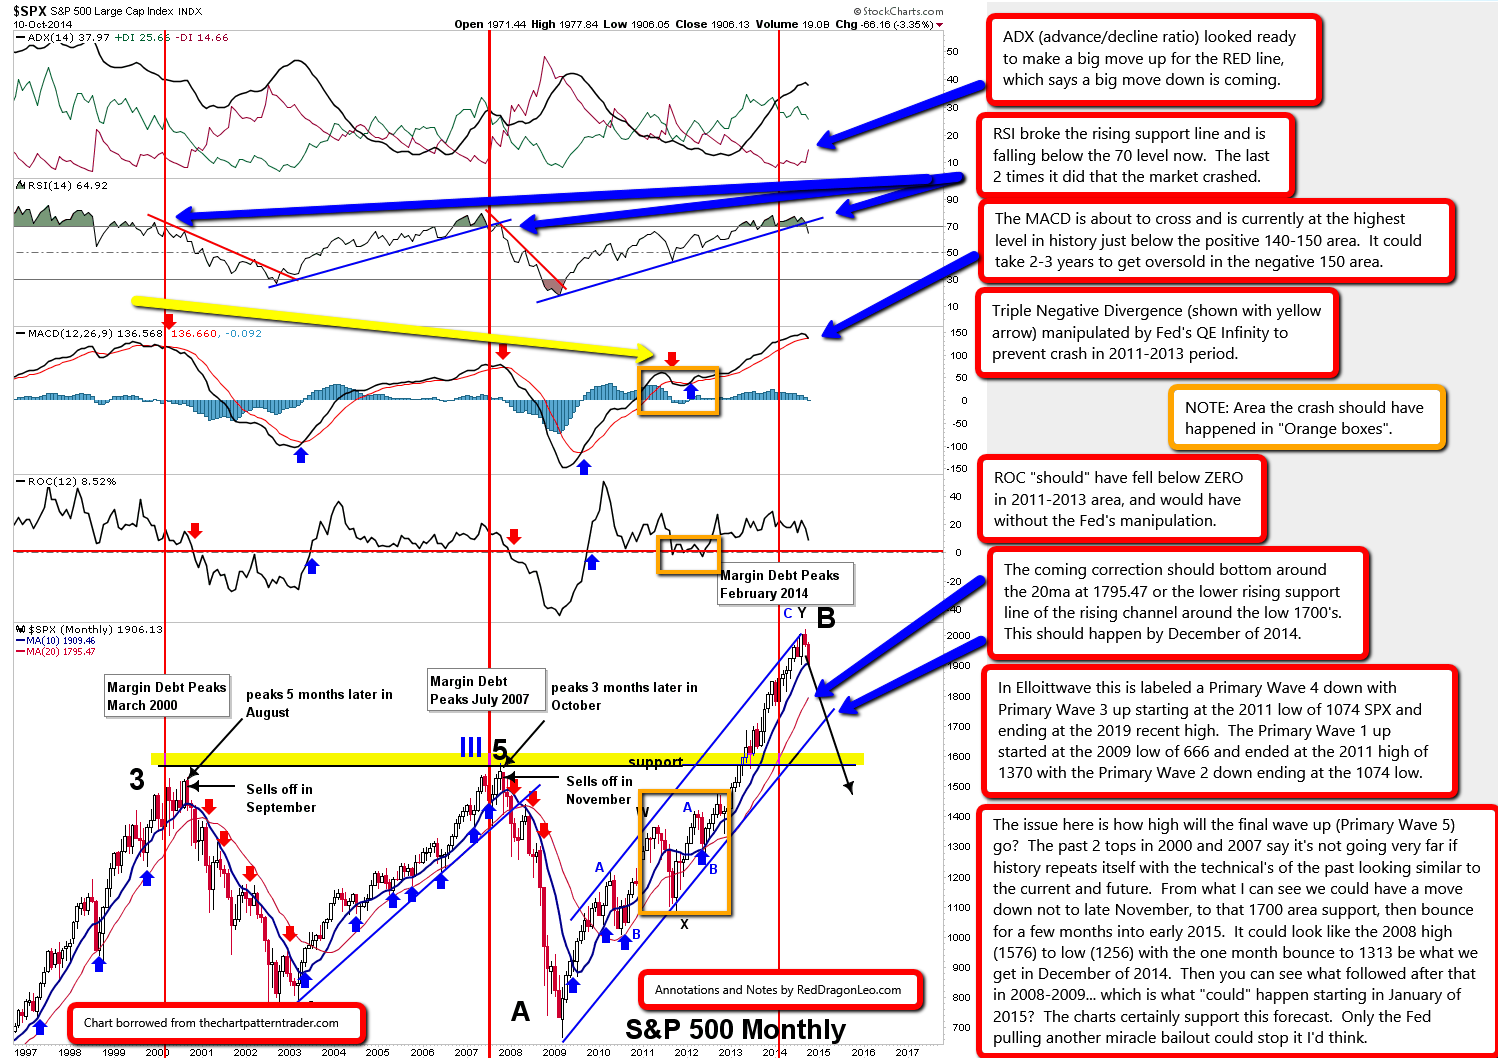
What does that leave for the government to do? I don't have a clue? You can see in the monthly chart below how we should have crashed in the last few years but were saved by QE Infinity (also known as QE3 [quantitative easing]}. Looking at the 2011 to 2013 period you'll see the market go from 1400 area to 1100 and stop, then rebound back up again creating the rising channel we see now. Now look at the ROC (rate of change) during that same period. It's hovering on the zero line for almost 2 years trying not to fall below.
When you compare it to the level the MACD's were at during that period, and then look back to the 2007 top to see the comparisons you would have thought the market would have crashed but the government intervened with the largest QE program ever... "to infinity and beyond as Buzz Bernanke would say"! It looked perfect for another HUGE "wipeout" crash at that time from a technical point of view.
You have the 2000 high with MACD's up in the 120-130's, then a lower MACD high in 2007 in the 60-70's, with the 2011-2013 zone peaking in the 50's creating a triple negative divergence on the Monthly chart. Clearly the market "should" have crashed then, but the Fed's intervened with QE Infinity. Now they have successfully manipulated the stock market up to historically levels. The MACD has never been higher in history (from what I read someone else).
What's all this mean you ask?
To me it says the likelihood of a "Full Blown Stock Market Crash" like 1929 is VERY likely to happen between 2015 and 2017. The biggest drop will likely happen in 2015 I think as I really doubt if we'll make some extended Primary Wave 5 up that last for 3 years or so with upside targets of 3000 or more. I'm more inclined to seeing a December 2014 rally that will look similar to rally May, 2008 that simply made a lower high and then crashed the rest of the year. This suggests that we'll top out in January, 2015 and then drop all year.
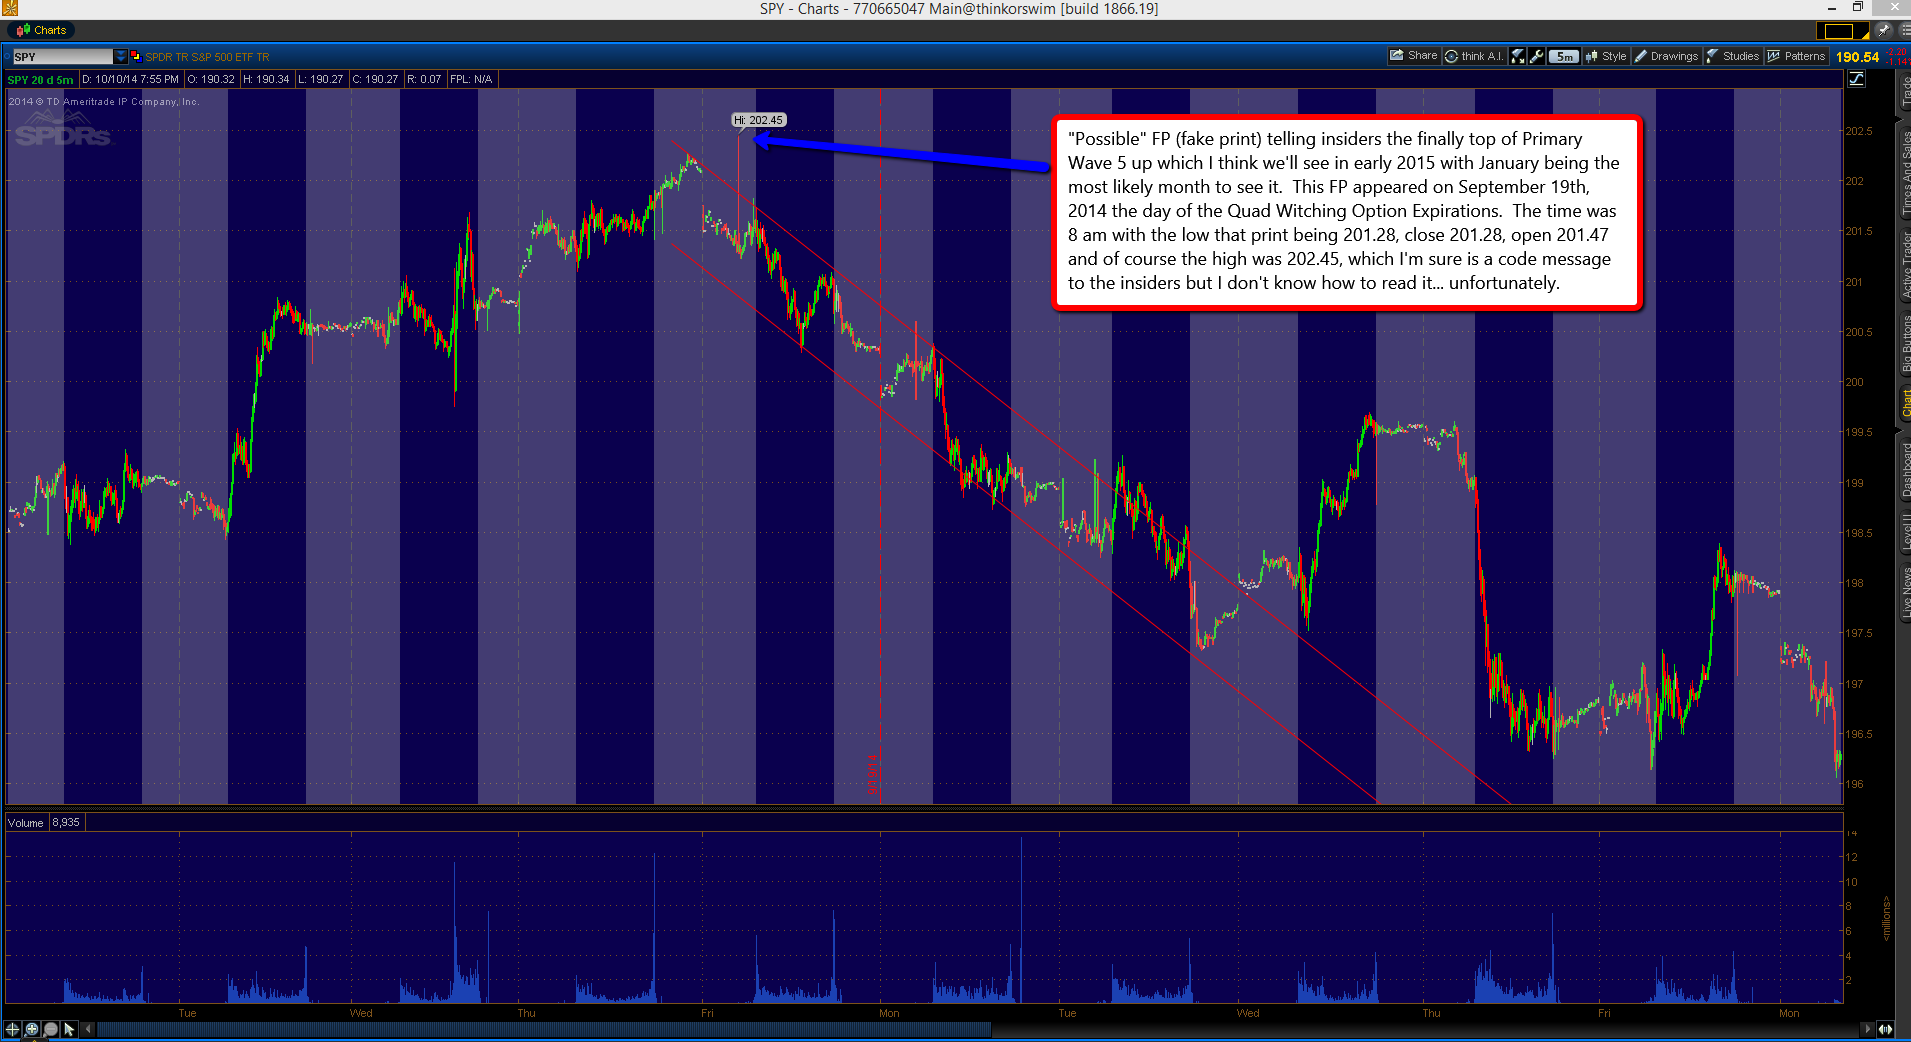
If the market goes down to the 1700's area where the lower trendline of support is on the monthly chart then that's the scenario I see happening... just a one month Christmas Santa Claus rally to make a lower high in January and then a crash. If however the market only goes down to the 20ma around 1795.47 on the monthly chart then there's a possibility that we'll rally back up to make a "slightly" higher high in early January to hit a "possible" FP (fake print) I spotted on the SPY back on September 19th, 2014 showing 202.45 as an intraday high. Since we never went that high that day it's "possible" that it's a FP signal to the insiders that know how to read it, which "could" indicate the final top in early January, 2015 after this correction is over with and the P5 (primary wave 5) rally starts.
It could be nothing of course... or a "real" FP telling insiders the final high for P5?
Let's talk about the rituals for minute now...
Yes, it's that time of year again when all the elite satan worshiping gangsters meet in secret (but right in front of you... if you are looking?). Of course I'm talking about Legatus, where we find every snake of importance in the world going to so they can find out the latest information on how the super elite gangsters (the true Reptilians) play to screw the sheep (that's you and me).
Their October meeting is going on now as it started on October 8th and ends this coming Friday October 17th, 2014. I've done many posts in the past about the importance of these meetings and how the gangsters like to "turn" the stock market before, during, or just after one of these meetings end (http://reddragonleo.com/2013/02/03/the-law-of-equilibrium-and-past-history-with-legatus-and-turns-in-the-stock-market). I called a very important top on May 22nd, 2013 primarily based on a Legatus meeting during that period, along with technical analysis and numerology. That date added up to a 33 when adding all the numbers in it leaving 22 as a whole since it's a master number.
Point being is that the gangsters commonly have "turns" in the market around these meetings and they use numerology to pick dates. Having this meeting going on right now and ending this coming Friday tells me it's likely to be some type of bounce back up wave to retrace possibly 50% of the entire down move from 2019 to whatever the low is... which I suspect will happen Monday around the 1900 area (+/- 10 points). So "if" we bottom at say 1890 SPX this week we could "should" retrace back up about 50% of the move down.
Speculating here but if we dropped from 2019 to 1890 then we about 129 points and half of that is about 65 points. So we should bounce to about 1955 area before we have the really big drop start. I think we'll hit that level by this coming Friday but it could go up a little more the following Monday to some other Fibonacci level like 61.8%, or 79 points from the 1890 low... meaning 1969 is possible. First of course we have to find the low to calculate from... which should happen early this week. Then we can guess on the upside target...
Usually high levels of open interest in the Puts for October 17th expiration...
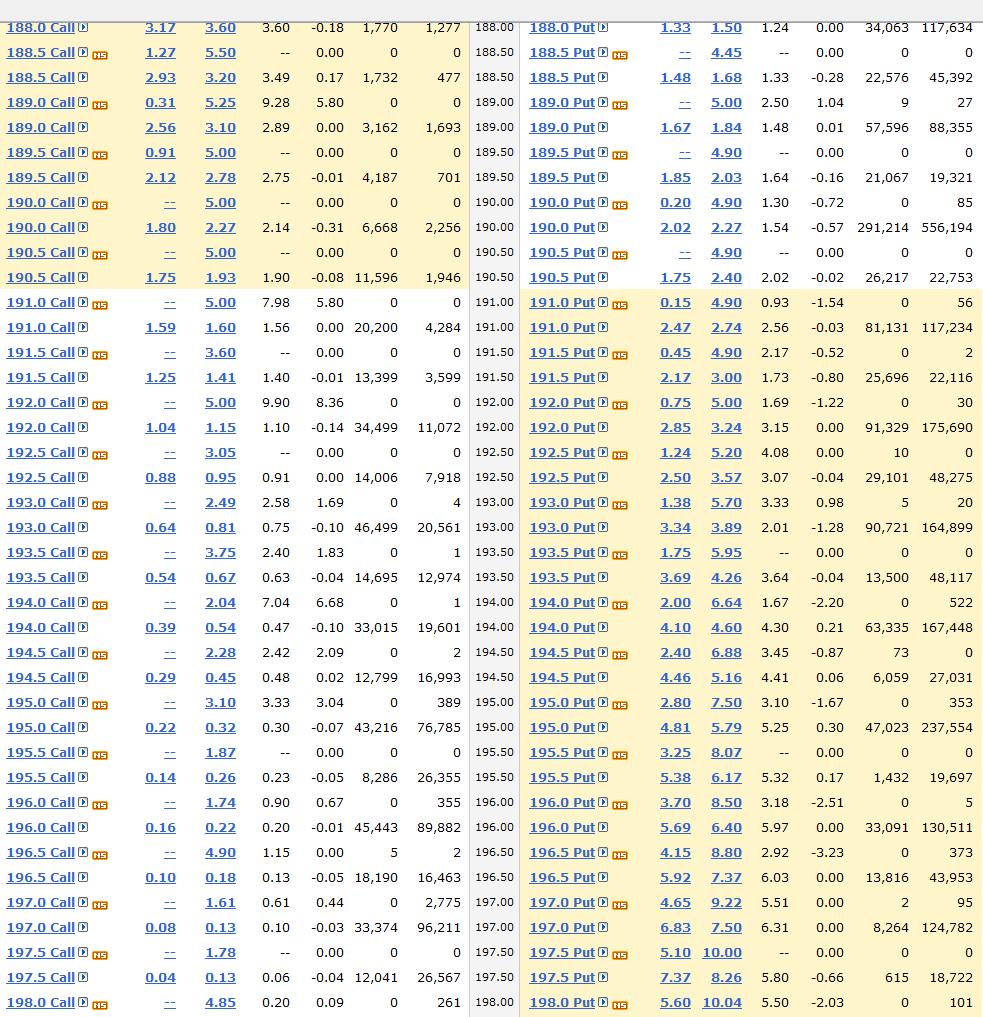
Since I like to trade options I'm commonly looking at the various strike prices, open interest, levels, days to expire, etc... and one of the things I mentioned a few weeks back in a comment and tweet was the very high level of puts in the 190 and 195 strike prices. On could imply that it's insiders buying them up as they know the market is going to fall below that level. But that's not usually the case. Most of the time it's just speculators that may or may not have seen the down move coming and loaded up short. However, from my experience the "market makers" will manipulate the market back up above the highest open interest levels to make those puts expire worthless.
So will this time be different? Maybe? I just don't know? Normally I'd expect to see 50,000 to 100,000 contracts on any given even number strike price and less then that on the odd prices with the .5's on the end but having 556,194 contracts at the 190 strike price is at least 5 times the normal amount I'm used too seeing. Then the 195's have 237,554 on them, which tells me the market makers will have to do a whole of digging in their pockets to pay out those put holders if they allow it close below 195 SPY (about 1950 SPX) this coming Friday the 17th. I can tell you that these guys are similar to card dealers in Vegas and will lose their job if too many people win at their table. So you tell me what you think they will do? I think they will rally the market up to make them expire worthless. In Vegas some manager would come out and have the dealer move to another table to break up the winning streak.
Of course there's no way to know for sure if the "insiders" are actually the one's that are short and know that the market is going down below there by Friday the 17th but certainly we'd expect to see a lot of wild swing "shakeouts" for the retail sheep holding puts. Then after the market makers sure up their positions they "could" let the market collapse late Friday after most of those puts holders have giving up and sold out at a lose. Anyway, I'm looking for some kind of rally this week as everything tells me we are oversold short term and due a nice rally.
But after the rally we should expect another HUGE drop the following weeks into the end of November. I'm looking for that rising trendline of support to be the low are before a bounce, which appears to be around the low 1,700's. If it's only a shallow sell off then the 20ma on the monthly chart "could" stop the fall, which is just under 1800 SPX. I'm unsure which will happen but leaning toward the lower target just based on the charts and how many weeks we have left before the end of November when I'm expecting a bottom to happen.
After that we get a Santa Rally I guess...
Red
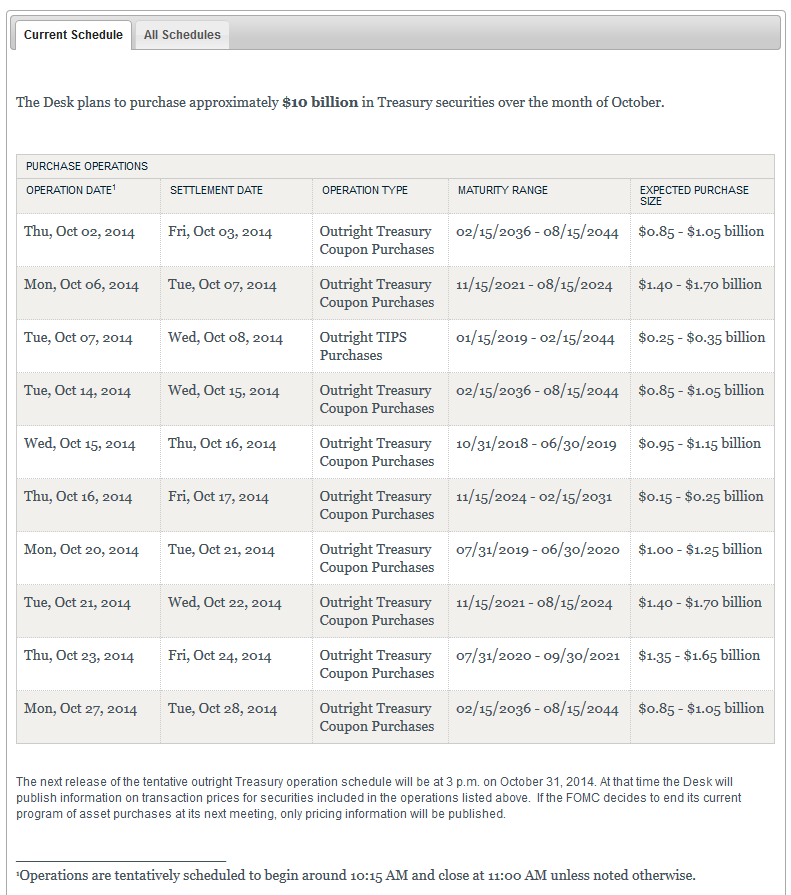
P.S. Let's keep an eye on the Fed's Outright Treasury Coupon Purchases too as they can add to the extreme volitalite as they try to save the market from collapse on these days.
I delayed writing this post for over a week as I just didn't think it was going to happen. Past history shows that every time we sheep hear something on the internet that is supposed to happen, and therefore we short the stock market, we end up getting screwed when the market rallies and the event date passes with nothing much happening.
But... is this time different?
I really wish I knew the answer there but I don't? The last 5 years have been a huge learning experience for me personally as I only started this blog to post my own thoughts about where the stock market was going to next. I never decided to take the "red pill" and become a conspiracy blog poster. In fact I never would have went down the rabbit hole if I hadn't seen my first FP (fake print) back on January 11th, 2010 showing a 97 point drop in the SPX that day when it really only traded in a 5 point range or so.
That lead me down the path to learning that the stock was 100% rigged... and always has been rigged since it was created many, many years ago. It's designed to steal money from the average long term investor sheep that doesn't trade the market everyday but puts in his or her savings into a 401k plan with the hopes of having a nice nest egg to retire on one day.
The gangsters the run the market (they are called the Illuminati, the Cabal, the Free Masons, but they are all the same) created this system so they could use these sheeps' money to pay for large projects they build in other countries where they find cheap labor to replace the current labor force in the current country. Meaning that they have the sheep in a country like America pay to have their jobs replaced by cheaper labor in a third world country.
Basically they crash the stock market from time to time to steal that money to pay for the building of the infrastructure of that third world country. The money they steal from the sheep from their retirement plans being cut in half goes to pay for the final outsourcing of the sheeps' jobs to that third world country. So when you hear a president come on TV and say that he is going to help "level the playing field" by creating jobs in one of those countries you now know that he simply means that he plans on replacing your high dollar job with someone cheaper.
The last stock market crash in 2008 was done to pay for the infrastructure of India...
The next stock market crash will be done to pay the infrastructure of another third world country that has even cheaper labor then America or India does. People there work for a dollar a day I'm told... which means that the gangsters that control the world can put a lot more money in their pocket by paying those people the pay YOU!
If you think they will replace you with a machine or robot you're wrong! You'll be replaced with another human that is less educated then you and will work for far less then you currently make. The biggest "outsourcing" of YOU is scheduled to be completed in 2017... which means you can expect a HUGE Stock Market Crash to start that year as it's the LARGEST project ever built, and that means it will be this biggest crash since 1929 as well.
But I'm getting off topic hear aren't I?
Sorry, but one of the things I always do is just write whatever comes to mind at the time. That means I go off topic from time to time as the thoughts just pour into my head. In fact, I never script anything or go back and change any videos. If I screw up in something I said I just keep on talking and post it anyway. Going back and editing out the "hmmm's and uh's" is a waste of time as I'm just as human as you are and make ton's of mistakes.
One of those is the penny stock newsletter. While I'm still struggling to understand this game so I can help all of you make money from it my partner and I are frustrated with alerts we've sent out. All the recent companies we've researched thoroughly and know that they all have huge potential. But it seems that they can't seem to get going to the upside even when a lot of other groups also see the potential and alert their members too.
However, that's another story. I don't have time to go into details about it now as I've got to tell you about what I see happening the stock market right now. Meaning that this Christine Lagarde video is something I must cover again. While I did a post on it back in January (http://reddragonleo.com/2014/01/20/when-will-the-stock-market-bubble-burst), and even though the date I forecasted back then was wrong the video itself is something worth revisiting.
I know that in the past 5 years I've gotten caught up in this "red pill" stuff and went short the market based on it... only to see the market rally and kill my position, some how this time "could" really be different? While I don't have a crystal ball I will say that I've never actually heard one of the gangsters (the elite... as in, Christine Lagarde) publicly say something that pointed to an "event happening" and a "date" for it. Truly this is a first... at least for me!
I'm probably 100% wrong on this call as I feel I'm the only person bearish right now...
Here's my thoughts... Lagarde is telling the truth as she is clearing saying that we are going to experience a big correction in the market this year. Why? Because it's a "magical year" as she clearly pointed out how important the number 7 is to the elite. The question is... what is the date she is talking about? And what is it that is planned to happen? Will it be a "Global Current Reset" as Lindsey Williams said will happen, or will it just be some other reason for them to tank the stock market? I don't know "what" the event is but the date does seem to be set in July of 2014 as 2+0+1+4=7 and July is the 7th month. The only thing left is the date of the month... which the 7th, 16th, and 25th all equal a 7, but which one? When combined with the month and year you'll have "magical" 777 day!
I'm speculating that it's on the 16th because of this Bradley turn date that peaks on the 16th...
Now of course I could be off and the date could be the 25th, but I must admit that "if" we some how put in high, low, open or closing price on Wednesday the 16th (a 777 day) of 1977.77 SPX or 197.77 SPY I'd be extremely excited about shorting the market as that would be a signal to the "Illuminated Ones" (which I'm not one of but trying to figure out their signals) that the top was in. Most people don't remember August 25th, 1987 other then that was the high for the year of 1987 but the crash was of course on "Black Monday" October 19th, 1987.
However, on that date the SPX put in an intraday high of 337.88... which the 88 is of course a master number meaning "11", but more importantly was the "not noticed" (except by the "Illuminated Assholes") intraday low of... [insert drum roll here] 333.33! YES, they put a clear signal that the top was in that day! Did you see it or know it? Not likely... in fact I only noticed it about a year ago after I started added numerology in my day to day chart analysis. Does it mean any? You tell me... does the March 6th, 2009 low of 666 mean anything?
Maybe I'm totally nuts and ritual numbers in the market are just random events, or maybe the market really is run by vampires called "reptilian shape-shifter"? People believed in demons centuries ago but modern man doesn't seem to think stuff like this is real... why? If they were real back then what makes you think that they some how disappeared today? If they ruled the sheep back then why shouldn't they still be ruling the sheep now? They just go underground (so to speak) and hide from the public, but they still run the show. In fact, the oldest vampires are probably in the Rothschild family and are the one's responsible for shooting down that plane in Malaysia. There was a team of 4 Chinese inventors that held a patent for 80% (20% between each of them) for something still unknown, with FreeScale Semiconductor owning the remaining 20% of the invention.
Now the interesting thing is that FreeScale is owned by the group building the new infrastructure (to eliminate YOUR job) which is called the Blackstone Group. And Blackstone is own by the Rothschild vampires... so do the math! They shot down the plane to get 100% of the patent as the legal contract stated that in the event of one of the parties dying the remaining percentage of would be split among the surviving members. Therefore, if you kill 4 people that own 80% of the patent the remaining company called FreeScale would then get all of that and own 100%, not the original 20% (nothing new here as the same vampires sunk the Titanic too, but that's another story).
Getting back on track again...
Again, I must apology as I sometimes just drift onto subjects that are off topic and I'm sure you don't care about that other stuff and just want and update on the stock market so you can make money from it. My thoughts have been simple really... a ritual number should but put in on Wednesday the 16th of 2014 to indicate that an important top is it. My "human side" tells me that they will take the market higher but recently I've been "talking to myself... LOL" for a lack of understanding and I've been told to short on Wednesday and that it would be a very important top... and that this Lagarde thing is real.
Personally I don't believe my "inter-voice" yet, as I've only recently (the last 2 weeks) been talking to it (yeah, if you didn't already think I was crazy you do now). I mean, come on now... I'll be 50 years old (although I look much, much younger... probably the blue eyes and blonde hair) this coming August 10th, 2014 (yes, I was born the year of the dragon in 1964 and the month of Leo... hence the name of this site) and I have to say that I feel like I'm only 30 years old. Crazy huh? It's probably because I never got married or had any kids to stress me out... LOL!
Anyway, this voice in my head has told me 4 correct calls in a row and I took 3 of them to make a bunch of money. I didn't take the Monday the 7th call was to get short within the first 30 minutes on the expect bounce. Needless to say I was dumb for missing out on that call and not listening to my inter-voice. I did listen and I placed a short on the 9th right at the last 30 minutes of the day. I think I tripled my money on that call (it was a put spread that expired that week... very risky). Then I went long at the bottom (missed it by a 1-2 points) on 7-10 as my inter-voice told me to sell and go long into this coming Wednesday the 16th.
However, stupid me closed out my call spread on Friday before Monday's rally up. So while I still made about 40% gain I could have made about 80% if I had listened to myself telling me what to do. This voice tells me to short the crap out of Wednesday's move with the expected high to happen by the noon time hour. I can't explain it but I've made a bunch of money on taking the 3 of 4 of these predictions with all 4 of them being correct. It's hard from me to believe that suddenly I've been in contact with my immortal soul (or directly with God himself/herself... LOL) but I've prayed about it months now. I really wanted to connect with myself through my pineal gland like all the gangsters do to connect to Satan.
But while others have been able to see visions and stuff I've seen nothing. I still see nothing. I'm probably nuts for even posting this publicly but myself tells me to do it... LOL! Well, there's nothing like pouring out your heart publicly I guess. So I'll just say again that I strongly believe tomorrow is an important day to take a short position. I don't know if there is going to be a "Global Currency Reset" like many think will happen (and Christine Lagarde hints at without saying directly) but the charts are very bearish and even without such an event we should be in a short position.
Here's the previous notes that I posted back in January...
2014 will be a magic year (meaning what? will you pull a rabbit out your hat? will you steal money from the sheep without them seeing you do it?)
100th anniversary of the first world war in 1914 (strangely when I researched what happened to the DOW back then it was closed down for several months due to the first world war starting. are we expecting the same here? REFERENCE: http://www.ritholtz.com/blog/2013/02/most-long-term-charts-of-djia-are-wrong, http://measuringworth.com/DJA, https://www.globalfinancialdata.com/gfdblog/?p=1426 )
70th anniversary of the Bretton Woods Conference that gave birth to the IMF. (The delegates deliberated during 1–22 July 1944, and signed the Agreement on its final day. REFERENCE: https://www.google.com/search?q=first+bretton+woods+conference+date&ie=utf-8&oe=utf-8&aq=t&rls=org.mozilla:en-US:official&client=firefox-a&channel=fflb Not sure what the hidden message was here?)
25th anniversary of the fall of the Berlin wall (Destruction date: November 9, 1989… but what is she hinting at here? Is the “buzz word” the “25th”or the “fall”? Does the 25th mean a certain future date or does the word “fall” indicate that the market will fall hard?)
7th anniversary of the financial market jitters. (again with the focus on the number 7… meaning what? are we looking for another move down similar to 2008?)
The crisis still lingers… (clearly this means we are going down again)
It will not happen randomly… (of course not, it’s always planned)
“Global growth is still stuck in low gear” (Hmmm… just a fall guy to blame I guess? We tank and it’s the fault of slowing global growth)
It will not be without downside risks, and significant ones (referring to inflation… or was it really meant to refer to the stock market?)
We are seeing rising risks of deflation… (good for us sheep but bad for them)
Global growth slowing down as the economy cycle turns… (the “buzz word” that stands out to me there is “cycle turns”)
Risk of capital runs… (You really mean the gangsters are moving their money out the market before the collapse)
Dry run back in May of 2013… (Ah yes, the old test where Bernanke hinted at pulling money out the market last year)
There could still be some rough waters ahead of us… (another clear warning that they plan on taking the market down)
Overall, the direction is positive (meaning after the downturn the market we’ll go back up again, which should be a final Primary Wave 5 up with this coming correction next month being a nasty Primary Wave 4 down)
95% of the income growth went to the top 1% (Duh… nothing new there as that was always the plan! Steal from the sheep and give to the wolves)
Tapering will have too be very well timed… (again, she’s clearly staying that we are going to withdraw money from the market)
Central banks will have to “undo” what they’ve done… (and again, more references to cutting back the stimulus?)
Removing the threat of the debt ceiling… (meaning what? They won’t set one, or make it unlimited? I don’t know what she means with this sentence?)
A stress test will be done in 2014… (Why? You already know the banks would all fail. I guess they have to blame the correction on something)
I'll point out that unless you are truly one of the elite it's not obvious to the date of the event or the actual event itself. It's only obvious that we are in for some rough waters in this magical year of 2014. Does that mean we tank in the stock market? Does that mean we have a global currency reset? I just don't know the answers there but I sure do think this market is ready to take a nose dive. So assuming we don't gap up 10+ points on the 16th I'll be looking for some ritual number (like 1977.77 SPX or 197.77 SPY) to be hit early on which I'll be shorting for a ride down to 1900-1920 SPX area in the coming weeks (or less?).
The market is currently experiencing some of the light trading volume days I've seen in a very long time. It's preventing the bears from having any pullback at all. While we "should" have had a 2-4% SPX pullback recently it just hasn't happened and doesn't look like it's going to happen anytime soon. Possibly we'll get some "one day wonders" of 20-30 points down in the near future but I wouldn't count on it. The old saying is "never short a dull market" and this is the dullest market around.
I'll go over the charts in the video but any bearish case (and there's a whole lot of them) will probably NOT play out due to the light volume we are having that keeps the market up in spite of everything else. Some even say it feels like the 1999-2000 run up in the market... just a slow grind every day to put everyone to sleep as it defies gravity and just never has any decent pullback to get long at. Everyone was forced to chase it... at least until the END!
While I'm not expecting this year to crash like it did back then I am expecting a 10-15% correction later this second half of 2014. The real crash is around 3 years away I think. However, I was expecting some pullbacks of 2-4% that I would like to play on both the downside and the upside rally that would follow. It's just not looking like I'm going to get it until we see some more volume in the market. We are very far away from all the moving averages below and various support levels, which normally CANNOT be sustained for very long without a correction. But we are NOT in a "NORMAL" trading period as the volume probably the lightest we've had for the last 5 years or more.
It tells me that the Fed's have instructed the big institutions NOT to sell, which will allow this light volume float up to continue much longer then it should. It's obviously not the Fed's QE money pushing this market up as they are taking more and more of it out the market at every FOMC meeting, so it's got to be the small retail sheep buying it up here as there's no one left but them.
Lets examine this daily chart of the SPX for a minute...
Looking back to December of 2013 you'll notice how the market hit overhead resistance, pulled back for a couple of days (30-40 points), went back up and hit resistance again and then pulled back for a 2nd time for another 30-40 points.... and finally rolled over for about a 6% correction to bottom at 1737 SPX in February of 2014. Then we rallied up until March before tiring out and after several days of chopping sideways we dropped for a few days... again 30-40 points.
Then back up to peak at 1897 in late March, which was then followed by about a 4.5% correction. Each time the market dropped to hit the rising trendline of support from 2011 and bounced back up from it. That's why I was expecting only a 2-4% correction this time as the market was making smaller corrections each time as it was coming to the end of the rising wedge.
This most recent time the market chopped along that rising trendline of resistance in the 1920 area for many days and couldn't get through. Everything looked similar to the prior 3-4 times except that we were actually more overbought this time thing previously. So what changed? Why didn't the market rollover again? The only answer I have is "EXTREMELY LIGHT VOLUME!".
So what's next?
My best guess is that we continue higher with that next overhead resistance line being the next upside target. It looks to be near 2000 SPX on the chart but it's hard to tell for sure as it rises every day. But if there are a lot of bear stops still left after Friday's breakout move then the bulls could put a nasty wave 3 squeeze on the bears and run this up higher then we could believe this week.
However, the more likely scenario is that we backtest the broken trendline of resistance in the 1925 area that will now become support. This week is usually the pause or down week with the bottom being put in on Thursday or Friday, and then next week is usually the super bullish week as it's the month option expiration week.
With that said I'd look for a long position on a pullback to backtest that broken trendline as the odds are strong that we will now continue higher with 2000+ being the upside target area. Once we hit that rising trendline (which again is in the 2000 area currently) I could then see a pullback to the middle rising trendline that we just broke out of late last week. It could rise up to 1930-1935 by then... depending on how long it takes us to first hit the upper rising trendline near 2000.
Catching a bear move is during a cattle drive isn't exactly the easiest thing to do!
One might view this slow grind higher as cattle (the bulls) being driven by some ranchers (banksters) from one coast of America to the other coast with some random bear attacks at night when the cattle are sleeping and the ranchers are passed out from drinking too much Whiskey. The bears get a few of the cattle but the rancher always wakes up the next morning to protect the herd.
So until these cattle are delivered to their final destination and read for slaughter I'd be cautious on the shorting, and instead you might just want to go long once that middle rising trendline is backtest this week. My best guess is that we peak out on Tuesday in the 1960+ area and then drop back into Thursday or Friday for the low... which again should only backtest the middle rising trendline that we just broke out of last week. It should be in the 1930 area by Tuesday but with the 10 day moving average at 1923 we could see that hit to trick the bears by piercing the trendline of "now support" (former resistance) on an intra-day move.
It's common for them to briefly pierce through support and resistance levels I've noticed as it lures in the suckers just before the turn and go the other direction. I think that area just below 1930 is a good entry for a long into the 3rd week of this month as it's option expiration week and is bullish 80% of the time. You could probably get long and this Thursday or Friday (June 12th or 13th) and ride it up to that 2000 area which could come as early as by the following Friday the 20th (no guarantee on that time frame though).
Naturally everything I'm speculating on here can change (and usually does... like 100% of the time! LOL), so keep checking the comments for updates as time goes forward as I post any changes there which also get reposted on Twitter and Facebook.
Hang in there bears, you only have another month or so to go...
The Scary planetary alignment due on April 21st, 2014 which is synchronized with the upcoming huge financial asset bubble burst! Be ready!
Certain important planetary alignments can be used to project both the minor and major turning points in stock market. In other words, some important planetary aspects can be used as a great timing tool in the stock market activity.
There are two systems of measurement that define the periods of the planets; the “sidereal “and “synodic” systems. The sidereal period is the time it takes a planet to complete one orbit. For instance, the sidereal period of the earth is 365.25636 solar days or Mars whose sidereal period is 687 solar days. On the other hand, a synodic period measures the period between two successive conjunctions of two planets. For example, the time interval between two successive conjunctions of Jupiter-Uranus is 14 years.
The planetary aspects are created when the important angles of the planets are aligned. As a matter of fact, such angles have traditional names; Conjunction(360 degrees), Opposition(180 degrees), Trine(120 degrees), Square(90 degrees), Sextile(60 degrees), Semi-Square(45 degrees), Semi-Sextile (30 degrees).
One of the most important planetary aspects is due on April 21st or 22nd, 2014 which could be synchronized with a nasty financial crisis.
Actually, It will not be the end of the world though. At that time, Uranus is exactly square (the 90-degree aspect) to Pluto. It is also square to Jupiter and both Jupiter and Pluto are square to Mars. You see, all four planets are either 90 degrees (Square) or 180 degrees (Opposition) to each other. It could be a real scary planetary aspect which might impact the financial markets, especially the stock market BIG TIME.
It is really important to understand that big world events are not necessarily synchronized with the major planetary aspects, the exact date on which they occur. Sometimes a couple of days before or after or even a couple weeks before or after. You have just begun to see the turmoil in the stock market though.
A shot to the new highs but April is the month you need to watch closely!
As you know, incoming US economic data in early 2014 have been largely disappointing and the Fed blames the weaker performance mainly on the impact of unseasonably cold weather on consumer spending, industrial activity and construction. In January, retail sales data came out well below expectations, existing home sales and housing starts started trending significantly lower, US manufacturing activity also appeared to be decelerating , industrial production declined at the beginning of the year, durable goods orders continued to contract and ISM manufacturing index dropped to an eight month low.
US real GDP is expected to advance 2.8% this year and 3% in 2015, roughly a percentage point above 2013. Actually, the Fed believes the events and factors at play are short-lived and the US economic recovery remains intact. Actually, this bunch of weak economic data has not yet convinced them to let the market drop as it has all been the weather’s fault not anybody else….
As for the geopolitical tensions, Ukraine crisis cannot just be ignored. Actually, it is a global crisis and will not be a one-day news story which will fade away soon. You see, it has a real potential to be escalated real soon. All eyes are on Russia and Ukraine, watching them closely.
As you saw, after a sharp decline to open the trading session on Monday, the markets immediately recovered all over the trading day following Mr. Putin’s latest statement, relieving the buyers who were actually looking for value on the dip, and the buying has been continuing to open up the session for tomorrow so that we can see a shot back to the highs. In fact, buyers are all in control, buying the dip whenever they get a chance and we may also have new all time highs. But how much is it going to last?
In my previous post, I mentioned that the market could exceed the levels on my charts, as I somehow knew the “central planners” would be able to get the situation under control, and then put the blame on the bad weather. But how are they supposed to fight the serious events that are about to come up in April. Yes, you heard me, April! Actually, next month will be a rough month for investors and financial markets. Keep an eye out for the markets around these dates, April 15th, 24th and 29th.
I have repeated over and over again that the market will have to correct on the monthly chart as the cycle has just completed and they (central planners) are trying their hardest to hold it up as much as they can. Whether it is a serious geopolitical tension or a financial crisis which might pop up out of nowhere in April and cannot be blamed on the weather, the stock market will have to retrace a major portion of the gains which has been accumulated since the rebound of 2009. If that does not happen, I will sure need to go back to the drawing board to just find out what is wrong with my cycle analysis.
Looking at the charts on the various time frames I could argue a case for both scenario's. One will be right and one will be wrong so we simply have to play the safest bet which I think will be long around the middle to the end of this coming week... but ultimately we know that the powers that be already know which one will play out and it's our job to read their minds.
For right now I think we can all agree that the direction is currently down. But a bottom should appear sometime this week, with the 19th-21st being the idea time frame. Why? Simple really. The coming FOMC meeting on Wednesday the 19th should gives us the clues we need. Assuming that nothing changes and the Fed's decide to continue with their plans to withdraw more of the QE money then we should logically expect some negative reaction from it afterwards. But, as we all know, the market thinks and reacts ahead of the news... which means that "most" of the selling should be about over with by the time the news is released.
I'm looking for a target low of 1810-1815 SPX for the first area of support. But, I suspect that for that level to work out as being the low we really need to rally some ahead of this coming FOMC meeting. Technically, we are do for a bounce but with the meeting still in front of us I suspect that we will not bounce any and just continue drifting lower due to the fear of the "unknown" from whatever will be said at the meeting. So, we could actually drop to that zone going into the meeting instead of bouncing up to an overhead downward sloping trendline of resistance in the 1860 area.
While we know that one should never trade off the news as it's already built into the charts ahead of time we also should know that with some pending (possibly negative) news lurking just a few days away shouldn't expect any turn back up just because some short term charts are getting oversold. The market does react to news as it's put out their by the powers that be to mislead the sheep in the wrong direction by having something to blame the selling or buying on. Of course if there was no Fed meeting this week then I'd expect the market to bottom around the open on Monday and start rallying from oversold short term charts... but that's not the case here!
So, we should expect the market to chop around until the FOMC minutes are released Wednesday around 2:15 pm, with a downward bias of course. I suspect that we'll end up dropping to that 1810-1815 area prior to the meeting... which should get a lot more short term charts (and the daily too) in an oversold condition, which means the bottom will be near.
Then once the news is announced that they have decided to "stay the course" (meaning to continue withdrawing money) we should see another move down out of fear (done by the retail sheep of course), which could drop us to the rising trendline of support in the 1790 area. Bears should be all over it as it breaks down through the "even number" level of 1800 and that's about when I think we'll bottom.
I've noticed that "Skynet" (the name I've given to the super computer that manipulates the market) has routinely pierced through important levels briefly to lure in the last retail sheep just before switching and going the opposite direction. It should be the same thing for the bulls "if" we rally up to new higher highs in the coming month hit 1900... which of course should be pierced by 5-10 points to trap those bulls long. While I don't know if we are going up to new highs or not I do believe the coming low will trap the bears short... which is why I suspect 1800 will be broken briefly.
I've seen this happen many times in the past and have calculated that these moves usually last 18-20 calendar days and drop 80-100 SPX points. They also don't give use bears many chances to get short with a decent bounce. While I'd love to see a bounce to that downward sloping trendline of resistance (around 1860 now) we might not see it at all? That bounce might not show up until after we bottom in the 1790 area, and then it will of course be lower (in the 1850 probably).
I think the thing to do is to see where the market trades at on Monday and Tuesday prior to the meeting. If it doesn't fall to the 1810-1815 area and instead chops around in this 1840 zone then we could see some brief rally up to hit that trendline right around the FOMC minutes to scare out the bears that are currently short. Then a drop to that 1790 area within a couple more days following the meeting. That would suggest a low by Friday the 21st, which could be the plan Skynet has for us sheep?
The other plan would of course be a continue drop into the meeting with a low in the 1810-1815 area when the minutes are released, followed by some panic selling to the 1790 area, and then a rally back up to start from that day forward into the rest of the week or more. The only thing I see here that has high odds is that we will continue down more next week and probably bottom in the 1790 area. Then the rally that follows could put in a lower high (then the 1883 high) or make one last higher high in the low 1900 area.
Therefore the safest plays I see here are to short any decent bounces with a exit low area of 1790 and then get long for a rally to at least the downward sloping trendline of resistance, which should be in the 1840-1850 by then. After that I don't know? We'll have too see what the charts tell us at that time as well as the propaganda being pitched to us sheep on the main stream media news channels.
If they continue to preach the end of the market scenario then we should expect the resistance to be broken and another higher high is likely. If they talk about the market going to new all time highs then we should be shorting and expecting that resistance to hold and the expected right shoulder (of what should then make up a nice "head and shoulders" pattern) to become some type of "Wave B" up or "Wave 2" up... meaning a big wave down should follow.
It's really too early to know which will play out so for now I'll just be focused on this coming week and will as always give you guys updates in the comment section as things change and play out in real time. Making forecasts this far in advance are just to be used as a general road map of what to look for... not to trade off. The charts change daily and the best I can do is tell you what I see today. Always read the comments for updates.
Why will the huge stock market correction happen real soon?!
…by Ali Firoozi Yasar
I am not being paranoid here and aside from the cycle-work, there are clear reasons that a dramatic decline in the stock market is on the way. Actually, it could strike any day now. The market is just hitting pre-crash tops, we being at the beginning of a new bull market is all over the financial media and companies are still reporting positive earnings but you folks should be aware that the stock market is on the verge of another huge decline.
The annual S&P 500 consensus earnings per- share is expected to come in a lot lower than originally predicted. You see, estimates were so close to $125 in January 2012, and now have dropped 10% to only $112. In spite of the warning sign of declining earnings, the S&P keeps on going up.
The investors and traders are extremely bullish on the stock market now. As a matter of fact, the reading is getting close to a 10-year high, and most of you guys can tell from experience what happens if market sentiment is at extreme levels one way or the other. If the small traders are so bullish, you’d better be cautious. You know better than anybody else that what happens to sheep?! Sheep gets slaughtered.
Actually, I could name many other factors but now we have enough evidence and clear reasons (aside from my work) that the stock market is awaiting a drastic correction which could result in a dramatic stock market decline, 50% unemployment, and 100% annual inflation starting this year.
The charts I showed you in my last post the general trends of the market. In other words, the market may or may not exceed the levels I indicated on the charts. Actually, I only wanted to warn you guys to be prepared for the “unthinkable”.
I hope, you guys will consider this a wake-up call, especially those who are not prepared or willing to admit an ugly truth.
As most of you folks are ware, we have recently received important news about the economy: GDP, Weekly jobless claims and pending home sales data and also an additional $10-billion QE tapering through the FOMCs latest statement.
The annualized GDP rate sounded OK. Consensus was for a reading of 3.0% but in fact, the 4th Q estimate 22% in three months. The weekly jobless claims were supposed to show a reading of 327,000 but the actual data was a bit quite worse, at 348,000 new jobless claims. And eventually, the pending home sales data came out which was really terrible! You see, economics’ consensus was for a small depression of -0.5%; however, the actual release was -8.7%.
Please check out the chart No.1 below. As I had already anticipated, the market topped out and the prices kept on moving down, finding support at the 1761.00 area. You see I am not so precise on the charts as I solely intended to show you the model, not focusing on the exact price&time levels.
Now check out chart No.2, even though the markets will do what they are supposed to do, the main- stream analysts and advisers attributed the brief rebound on January 31st to the better then expected GDP figures and they would still like to see if the rebound is able to maintain the momentum to the upside, hoping the prices will go to the Moon, not knowing there are not many buyers left and it is time for a good break.
The prices will bounce real soon, back-testing 1810.00 area in order to suck in more retail traders, or we could see the market rally briefly, then a sideways chop, after that a drop to the lower levels as indicated on the chart. You see, my business cycle suggests that the U.S economy is ailing now; you may also see bad earnings reports during the coming days, adding fuel to the flame, consequently the market will have to correct and have a good break before it starts recovering again.
May you play it safely and profit handsomely,
Ali
_______________________________
When will the stock market bubble burst?
...by Ali Firoozi Yasar
Hello folks!
Hope all is well with you guys. I know it has been a long while since I last posted on Red’s blog. I have been super busy at work, so my apologies for the long absence. But now it's important to get you all this update as the time is near.
The stock market is at a critical moment! Goldman Sachs has suddenly decided to warn all of us that the stock market could decline by 10 percent or more in the coming months! But are they just honestly trying to warn their clients that the stocks have become overvalued at this time or is it just another agenda at work?!
Whether it is an agenda or not the stock market has just entered a very dangerous zone. Stocks are massively overpriced and investors have been borrowing huge amounts of money to buy stocks. Consequently, the margin debt at the New York Stock Exchange is truly at a crazy level!
These kinds of behaviors and signs actually indicate that another bubble burst is on the way. On top of that the state of overall U.S. economy is getting worse while the market is soaring to new highs. It is not a good sign folks. The U.S economy is in a very bad condition now, in fact it's in a much worst condition then it was the last time we had a major crash back in 2008.
Employment is much worse now that it was at that time and the U.S banking system is more ailing with more debts than it was back then. It owed about 10 trillion dollars but today the debt has increased to more than 17.2 trillion dollars. The market keeps on fooling the masses with this illogical bubble, but this "fooling" can't continue.
I highly suspect this massive stock market bubble will not last for much longer, and a lot of financial market experts are now advising and warning their clients to prepare for a substantial pull-back. You see the market was manipulated by the Fed in early August when a dramatic decline was due.
A lot of people had already been aware of that, which was probably the reason for the delay until now. The bottom line is... the energy of the current run has fully been drained and the Fed is not able to fight it any more.
Actually, it can be likened to a man who has been holding a big weight over his head for a little while but now his energy is getting depleted. So he takes a quick shot of Adrenaline to keep him going a little longer (aka "more printed money secretly injected into the market... [most likely]), and you know it's his 4th, 5th, 6th shot or more? With each time the effects last a shorter time compared to the one prior, and I think this is the last shot before the weight is dropped!
As mentioned above, the market was manipulated by the Fed in early August and it has been tolerating the burden since then. They are not able to hold it up anymore. This is actually what I see in the S&P500 based on the cycle work and harmonics. I am afraid I cannot give out much information here as it could be leaked and copied.
I believe the market will put in another high but the length of the rally will be relatively smaller, then a sharp decline to the 1350 area is possible. After that, a rally back up to new highs (the 2100 area is very possible) will probably follow. You see, it can be a huge opportunity to enter the market with a large short position when the time is right. As soon as the decline kicks off there will not be a major pullback to re-enter so you would want to make sure not to miss the ride at the very top.
Last Thursday and Friday we seen the start of a very nasty correction that is coming and should last all of February and into early March before bottoming. While I did not know the exact date of the top it appears now it was last Wednesday, January the 22nd. In my previous post I mentioned that it was possible that traders would start selling off a week or two ahead of the coming FOMC on the 28th and 29th, as well as the debt ceiling deadline on February 7th... and it looks exact like that's what's happened.
From here I'm now expecting a short term bottom sometime Monday and a rally into Wednesday the 29th when Bernanke speaks. This rally should take us up to the 1825 SPX area to just under the 1850 prior high. There's a downward sloping trendline there that should stop the bulls on this bounce, which will be some type of wave 2 up with the recent selloff being the wave 1 down.
The price level isn't as important as the time period as we know that around 2:15pm on Wednesday there is extremely high odds that the rally will end shortly before the FOMC minutes are released. Whatever Bernanke says I fully expect it to be negative for the market and will start the wave 3 down into Thursday and Friday of this coming week. I would expect the current low of 1790 to be taken out on this next wave down.
This will be Bernanke's last speech before the new woman takes over as Fed Chairman. I previously speculated that the big downturn move would happen either at the FOMC meeting on the 29th or the debt ceiling deadline on February 7th. Looks like it's going to be the 29th for nasty wave 3 down to happen.
Then when the 7th comes up and they are unable to reach an agreement I'd expect another dump to happen. However, if we rally early this week as I expect and then dump from Wednesday to Friday I'd expect some type of bounce the following week on "hope's and prayer's" that they will say something positive on the 7th to end the selloff.
But I doubt that will happen as I believe the elite themselves are giving those of us awake and listening the exact road map of what is coming. In this video by IMF head Christine Lagarde she (strangely) starts off her speech by discussing numerology (fast forward to the 6:30 minute mark and start playing the video), and she talks about the importance of the number "7"... which she makes reference to by saying the following quote:
"2014... drop the zero, 14... 2 times 7... that's just by way of example"
Really? Example my ass! You are clearly saying that 2-7-14 is an important date! That's February 7th, 2014 of course, which is right in the middle of the 3 day Legatus meeting held February 6th to the 8th, and also happens to be the debt ceiling deadline date. Do you believe in coincidences? I don't... not with all the other "buzz words" that she drops in her speech.
2014 will be a magic year (meaning what? will you pull a rabbit out your hat? will you steal money from the sheep without them seeing you do it?)
100th anniversary of the first world war in 1914 (strangely when I researched what happened to the DOW back then it was closed down for several months due to the first world war starting. are we expecting the same here? REFERENCE: http://www.ritholtz.com/blog/2013/02/most-long-term-charts-of-djia-are-wrong, http://measuringworth.com/DJA, https://www.globalfinancialdata.com/gfdblog/?p=1426 )
70th anniversary of the Bretton Woods Conference that gave birth to the IMF. (The delegates deliberated during 1–22 July 1944, and signed the Agreement on its final day. REFERENCE: https://www.google.com/search?q=first+bretton+woods+conference+date&ie=utf-8&oe=utf-8&aq=t&rls=org.mozilla:en-US:official&client=firefox-a&channel=fflb Not sure what the hidden message was here?)
25th anniversary of the fall of the Berlin wall (Destruction date: November 9, 1989... but what is she hinting at here? Is the "buzz word" the "25th"or the "fall"? Does the 25th mean a certain future date or does the word "fall" indicate that the market will fall hard?)
7th anniversary of the financial market jitters. (again with the focus on the number 7... meaning what? are we looking for another move down similar to 2008?)
The crisis still lingers... (clearly this means we are going down again)
It will not happen randomly... (of course not, it's always planned)
"Global growth is still stuck in low gear" (Hmmm... just a fall guy to blame I guess? We tank and it's the fault of slowing global growth)
It will not be without downside risks, and significant ones (referring to inflation... or was it really meant to refer to the stock market?)
We are seeing rising risks of deflation... (good for us sheep but bad for them)
Global growth slowing down as the economy cycle turns... (the "buzz word" that stands out to me there is "cycle turns")
Risk of capital runs... (You really mean the gangsters are moving their money out the market before the collapse)
Dry run back in May of 2013... (Ah yes, the old test where Bernanke hinted at pulling money out the market last year)
There could still be some rough waters ahead of us... (another clear warning that they plan on taking the market down)
Overall, the direction is positive (meaning after the downturn the market we'll go back up again, which should be a final Primary Wave 5 up with this coming correction next month being a nasty Primary Wave 4 down)
95% of the income growth went to the top 1% (Duh... nothing new there as that was always the plan! Steal from the sheep and give to the wolves)
Tapering will have too be very well timed... (again, she's clearly staying that we are going to withdraw money from the market)
Central banks will have to "undo" what they've done... (and again, more references to cutting back the stimulus?)
Removing the threat of the debt ceiling... (meaning what? They won't set one, or make it unlimited? I don't know what she means with this sentence?)
A stress test will be done in 2014... (Why? You already know the banks would all fail. I guess they have to blame the correction on something)
Ok, there your shortened version of what Christine Lagarde is really saying to us sheep. By now you should be about 99% confident that we are going down hard this February. They've clearly told us sheep the truth and you can't blame them if you weren't listening.
Now I really don't think we are going to have another False Flag event in the Olympics but I must say that it starting on the 7th with Legatus on the 6th-8th and the debt ceiling on the 7th is some might strange coincidences.
Lindsey Williams puts a date of "90 Days" until the elite will reset the currencies of 204 countries world wide!
While I can't say that he's going to be right... or wrong but this is first time I can recall him stated an exact time frame like this. He's previously stated dates like "by the end of 2013" or "by the end of 2012" the dollar will be basically worthless. That's not very specific as it's too speculative due to the nature of what one person calls worthless versus what someone else states is worthless.
But I will admit that the "buying power" of the US Dollar is a whole lot less today then it was in 2011 as I've personally seen prices rise on food significantly in the last 2 years. And I'll noticed the trickery of the companies selling food products by keeping the price the same but by decreasing the size of the container that it's in. I now see 59 ounce bottles of orange juice instead of 64 ounces, which is a half gallon. Other things they just rise the price on them or keep the box the same size but put less in the bag of chips as they just have mostly air in them inside a large bag.
It's crooked but it's all planned and done by the elite to keep us sheep stupid, fat and too tired to fight them.
I'm actually surprised that they let Lindsey state a time frame for the global currency reset. So either they are setting him to look like a fool when it doesn't happen or they are telling the truth and just don't care if we sheep know about it as there's nothing we can do to stop them. That's true I'm sure but while we can't stop them we can profit from it... "if" it really does happen in the next 90 days?
The 90 days starts from December 4th, 2013 so that means it's should happen by March 4th, 2014. Now if you listen closely to Lindsey's words you'll notice he states that "if Christine Lagarde gets her way" (she's the head of the IMF) then this global currency reset WILL happen. The thing that stands out to me is that he says that we'll first see them raid the pension funds of America and then shortly afterwards they will reset the dollar. So if we don't see them raid the pension funds then they won't be resetting the dollar by 30% as he states.
So how can you profit from this you ask?
Simple really... "if" we see them confiscate the pension funds and nationalize them within the next 90 days then there is a very good chance that Lindsey will be correct and that they will devalue the dollar here in America (and the other 200+ countries) "shortly thereafter" as he states. What Lindsey doesn't tell us in this video is what the new reserve currency is (but I think I heard somewhere it's going to be the Chinese Yuan?). But regardless of what the new currency will be one thing will NOT be affected negatively and "should" go up an equal percentage to the value the dollar goes down.
That "thing" is GOLD... and "if" this happens as Lindsey states we could see gold go up 30% overnight when they devalue the dollar 30% overnight. If one was to time this correctly and simply go long on gold via GLD by buying some "calls" a small fortune could be made. While I can't tell you what to do, which strike price to buy or when to buy it... you can figure this out if you just keep your ears open to see if they raid the pension funds first. As if that happens you'll know that they could do the currency devaluation shortly afterwards... and it should all happen before March 4th, 2014 if the 90 day period is correct.
You should know by now what time period I'll be looking at hard for a decision to be made (or canceled?) as I told you all many times to pay close attention to when these people meet at this organization because many times (not always) "turns" in the market happen shortly before, during, or after any of these meetings. The next meeting is February 6th-8th, 2014 so when the elite meet during this meeting they "should" make their final decision to "do" or "do not" reset the currencies and steal the pension funds.
Therefore my personal plan of action will be to look for them to steal the pension funds first and then shortly there after to devalue the dollar by 30%, and so I would be looking to buy some gold calls prior to the devaluation but after the pension fund raid. Now I might also by a small position of calls simply ahead of the February 6th-8th meeting with the expectation that "they" will be stealing the pension funds right after the meeting. They could do them both at the same time and therefore we'd miss the opportunity to get some gold longs via GLD Calls... which is why I might get some early in case they trick us and do it all together where we can't get long in advance.
I will suggest that those of you that are familiar with options to login to your account daily and look at the amount of "open interest" that shows up every day in the various strike prices of the "GLD Calls" for the month of January, February and March 2014. Why? Because insiders WILL load up on gold calls shortly before this global currency devaluation happens. If you see that please make sure you share that will everyone here on the blog by taking a screen shot and posting in the comments (or email it to me and I'll post it).
As far as the market I'd guess it won't necessary move it too much but I'm sure there will be some fear and therefore selling in it. I just see the biggest opportunity is in betting on the huge move up in gold. Right now the market is selling off some but I wouldn't be surprised if we rally this coming week and into the end of the year.
Red
P.S. Here's the link to the article I speak of in the video...
Over the last month or so I've been quietly making money in the junior stock market and enjoying some much needed rest. I've been eliminating all the stress of wondering what will the government do next to manipulate the big market by simply not playing it. It's too easy to make money in the junior and penny stock market that I just didn't want to write other post on where I think they will take the S&P500 to next. Why worry about it when you can make money in the junior market without sleepless nights.
If you read this blog in the hopes of finding that one secret golden piece of information that will allow you catch the exact top (and/or bottom) of the stock market so you can make a huge profit on the move down then you'll love profiting from all the new junior stock picks I plan on putting out in the coming months. I've been able to successfully align myself with the right connections where we spot this junior pennies just days before they explode higher!
I mean picks like PGSY that we discovered back on 8/30 at .02 cents just before it ran up to .07 for a 350% gain in only 5 days! That's HUGE! I realize that this market might be new to you but not playing it with gains of 50%-100% are common place... and most moves only take a couple of days! I'm in love this market market as it so easy to make money in it now. The connections I've aligned myself with are able to spot practically every winner in advance of them exploding upwards.
You see, there are "tale-tell" signs that show up before hand and the pro-traders I've surrounded myself with in this market know EXACTLY what to look for to find every one of these winners. Again, I'm not trying to sell on making money in the junior market instead of the big market, as if you are killing in there then congratulations. But if you read this blog because you're not making money regularly trading the nasdaq, s&p, russell, dow, etc... then YOU need to make a change!
Yes, yes, I'm going to give you an update on what I see in the big market in the coming weeks but I'm personally going to stick to trading these incredible junior picks I'm getting. Think of it like this... we bears (that's most who reads this blog) have been like small fish (maybe 1-2 feet long) swimming in the big bad ocean looking for food and trying not to get eaten from all the huge sharks around us (wall street market makers and manipulators), while I just escaped and found this nice quiet pond of water (the junior stock market) with nothing but small 1 inch minnows swimming in it just waiting to be eaten by a big fish like us!
If you align yourself with successful people and follow what they do then you'll become successful too...
I've do just that in the past month by making the connections with other successful traders in this junior stock market, which is something very few will ever be lucky enough to achieve. But you my dear reader are now one of the lucky ones as you will get access to all these HOT junior stock pick (some Nasdaq too) in my newsletter. So unless you have your own connections (like may Jim Cramer is your buddy) in the big market you'll going to still be a small fish swimming in the big bad ocean of sharks... unless you decide to join me in my quiet little pond?
This coming month and many months afterward my partner and our connections will be finding many more new winners BEFORE they explode higher and we will be giving them all to YOU in the newsletter so you can become a WINNER too! The coming bear market expected is something that is hugely positive for the junior stock market as traders flock to them in times of uncertainty... which is what I'm expecting in October and November of this year. Of course next year appears to be worst... which is GREAT for the junior stock market!
If you're not on my newsletter you'd better get on it asap as the coming turbulence in the S&P500 is going to make the junior stock market just that much better. Kinda like the farmer restocking the pond with fresh new minnows! Don't get eaten by the sharks, come take it easy in the pond. You can join here: http://reddragonleo.com/newsletter-sign-up
So everyone is wondering if the stock market is still going to crash in October? And the answer is... "define Crash?" If by crash you mean a total collapse like in 1929 and what Lindsey Williams speaks of in his messages he gets from his elite sources, I'd so NO. If you mean will it have a 2,000 or 3,000 point drop in the DOW, I'd say YES.
Based on what I'm seeing in the charts we have either already completed or will complete in the coming early days in October the very large Primary wave 3 up from the 1074.77 SPX low in late 2011, which sets up the stage for a Primary wave 4 down that only has to remain above that 1074.77 low of Primary wave 2 down to be a valid Primary wave 4... which is one hell of a drop! I'm not expecting anything remotely close to tanking that far down but instead I'm simply looking for the gap up open from January 2nd, 2013 to be the target zone bottom.
That's somewhere between 1420 and 1460 on the SPX, which is also about a 3,000 point move down on the DOW from the current high. However, I'm not sure if the high is in yet or not? Inside this large Primary wave 3 up we have 5 Major waves and we appear to have completed the 5 Major wave up at the recent 1729.86 high... but it's possible that we still have a little more to go yet.
Naturally there are smaller waves inside the Major wave 5 up as well, which started at the 1627.47 low. Since it's a 5th wave it too will likely have a 5 wave pattern inside of it. I currently can see a 5 wave pattern up from 1627.47 to 1729.86 which all makes up a the 5th Major wave up inside Primary Wave 3 up, which "if so" will complete that large wave and allow for a Primary Wave 4 down to start.
The timing of a huge wave down starting soon and the coincidental timing of the debt ceiling deadline... and the Legatus meeting is something bears need to be very aware of. The charts only say we are about to see a Primary Wave 4 down start (which can easily be 3,000 DOW points) but add in the other events that happen to be timed out to occur with the topping of the Primary Wave 3 up and I'd say we have really great odds of a big move down coming this October.
As for a date...
It depends on whether or not we have topped at the recent 1729.86 high or not? While I can count 5 waves up in this final Major Wave 5 from the start of it at 1627.47 there's also the chance that those 5 smaller waves are just some type of A wave and the recent move down to Friday's close at 1691.75 SPX wave a B wave down... all still inside that final Major Wave 5 up. This leaves us a smaller C wave up yet to come inside Major Wave 5 up... and that should then complete Primary Wave 3 up from it's start at 1074.77 in 2011.
So, if A = C then we can guess at the final high by adding the points moved up in the A wave to the coming expected low of the B wave (which I think we'll see Monday October 30th, 2013). And since that A wave started at 1627 and ended at 1729 we have about 102 points, which added to say around 1680 for a estimated low on Monday (for the B wave down still inside Major Wave 5 up) that puts our upside target for the C wave up around 1782 (102 points added to 1680).
Personally I think that's too much to expect and I'd be more likely to believe that we'd have a shortened C wave that just barely goes above the 1729 high... maybe we get to 1750? I just don't see 1782 with the current debt ceiling news hanging over the market right now. I guess if the news media comes out and says "all is well, we feel positive that we'll reach an agreement before the October 17th deadline" then the market "could" relax and rally up that high.
But time is running out as October is coming upon us very fast now. It just doesn't look like they will have enough time left to produce another big wave up before that deadline date hits. A shortened wave C up to complete Major Wave 5 up and Primary Wave 3 up seems more likely. There's a lot of "negative divergence" patterns showing up on different time frames in the various indicators (like the MACD's, the Histogram Bars, etc...) which tells me we "could" already be topped?
If we are already topped...
Then we have started the first wave 1 down inside of Primary Wave 4 down. This move looks about done with a little more downside possible on Monday before we can expect a wave 2 up to start. If this is the case then by this coming Friday October the 4th I'd expect the wave 2 up to end and allow a wave 3 down to follow the next week.
This should be a tricky period as after a 5 wave pattern down happens it will have made up a likely Major Wave 1 down inside Primary Wave 4 down. This means we could bounce up hard in an ABC Major Wave 2 up that could possibly come from a positive announcement on reaching some type of agreement about raising the debt ceiling or extending it into a future date. So if we see that happen on the 17th I'd expect a rally until the 22nd with that date being a likely top for Major Wave 2 up because it's a "double eleven" date... and you know how they like to use the power of Numerology in the market.
Think about that for a moment now. If we are in a Primary Wave 4 down (that can go 3,000 DOW points down easily) and inside that large wave we complete a Major Wave 1 down (into the 17th for the positive news outcome regarding the debt ceiling) and further completing the Major Wave 2 up by the 22nd then we are looking at a Major Wave 3 down to start inside a Primary Wave 4 down. That my friends should look like a crash wave!
This is again just speculating but it's a strong possible count if we have already topped and they announce some positive news on October 17th about the debt ceiling issue. You remember November of 2012 when the market sold off in front of the first time we experienced this debt ceiling issue and once it was raised we quickly bottomed at 1343 and rally hard into the rest of the year and into the first half of 2013.
We should expect the same to happen again once they actually announce the raising of the debt ceiling for the 2nd time. But, it seems likely that they will play around for awhile and not make that agreement until after we have sold off into the 1420-1460 SPX zone to complete this expected Primary Wave 4 down.
The question is, how do to do it?
Delay, delay and delay is the answer I believe. You tell the news that we politicians are working hard to resolve this issue and get a bill passed to raise the debt ceiling limit as soon as possible... but we don't have a deal yet. However, we are going to agree to extend it until late in November (again)... which tells the market to sell off until that period when they agree to raise the debt ceiling just like they knew they were going to do anyway.
It's all just a dance timed out perfectly to allow the market to correct hard in a Primary Wave 4 down scaring the hell out of traders and getting every bear in the world on board short... which then allows them to squeeze the bears up into early 2014 for Primary Wave 5 that finally will end the entire bull rally from the 666 low in 2009... and further allow the real stock market crash to begin!
These are the possible moves that are likely coming in October and while I'm not sure with one or which way they will play out I do feel confident that a Primary Wave 4 down will start at some point this coming month. It could already have started or we could have on more higher high still coming? Regardless, we should still bounce some next week into Friday October 4th. It will either end up being called wave C inside the final 5th wave up to complete Primary Wave 3 up, or it will be wave 2 up inside Major Wave 1 down inside Primary Wave 4 down.
Therefore, the logical thing to do is to watch and see how high the market bounces into the end of next week before shorting. If they some how spin something the law makers say next week to sound like a deal on the debt ceiling will be made soon then the pressure will then let up on the market and we could see a decent move up. I'm still NOT expecting a move to 1782 but a slightly higher high over 1729 is possible. Of course it could fail to make it and fall just under 1729 and make either what we could call a double top area or some other Fibonacci retracement level that is 10-20 below 1729.
I would welcome a squeeze up to make a new high as that makes it easier to fall when it rolls over as the bears would have been stopped out. But I can't control what they decide to do with the market between now and October 17th, instead I'll just be listening closely to their buzz words (as Lindsey Williams likes to call them) for clues.
We all know that they WILL raise the debt ceiling limit, but when is the question? There will be mixed signals from law makers as the play the dance to move the market in the direction they want. But come October 17th I'm NOT expecting them to say "we've decided to raise the limit", but instead I am expecting them to state something positive to squeeze out the bears with a rally into the 22nd (this assume we make a 5 wave move down into the 17th to create Major Wave 1 down).
However, if they have not went down into the 17th in a Major Wave 1 but complete that wave the week or so prior, thereby rallying up with Major Wave 2 (inside it should be an ABC pattern of waves) and the topping out before the deadline date, they should say something negative like "we've not reached any agreement yet and will be setting up another deadline in late November".
Naturally you can expect the markets' reaction from a statement like that to be very negative, so we'd see that Major Wave 3 down inside Primary Wave 4 down start immediately! Again, that would be your crash wave! This all assumes the plan is to continue down some more to make the Major Wave 1 and then back up into the 17th for the Major Wave 2 completion. This plan suggests the high for Primary Wave 3 up from 1074 is already in at 1729 and we have already started the first Major Wave 1 down inside Primary Wave 4 down.
The other scenario is that we still haven't topped for Primary Wave 3 up and we are head to possibly 1750 SPX or so into the end of next week or even into early the following week. Then as the days count down toward the October 17th deadline the market starts Major Wave 1 down inside Primary Wave 4 down as it waits for the announcement concerning the debt ceiling.
On that date the law makers decide to extend the limit for another month pushing the deadline into late November. The market rallies from the relief of the news to make the Major Wave 2 up inside Primary Wave 4 down. Then on October 22nd the market exhausts its' rally and realizes that the debt ceiling issue still hasn't be solved yet... and panic sets back in causing Major Wave 3 down inside Primary Wave 4 down to start.
Bata-a-bang Bata-a-Boom!
There you go...
Likely top for Major Wave 2 up inside Primary Wave 4 down should happen on either October 17th or the 22nd. Then Major Wave 3 down starts inside Primary Wave 4... and that my friends the the wave down you want to ride! It's the surfers dream wave that happens once or twice in a lifetime (found during hurricanes and tsunamis... which coincidentally is the same thing it will feel like in the stock market I believe).
Will the next market crash happen before or in mid-October?
... update from Ali
Hi folks!
I know it has been a quite while since I last posted on the blog, talking about the market plunge due in early August and such. Yes, actually my bad! You see I project most of the turning points but I really did a bad job projecting the crash. I knew for sure, the market would put in a top early August and it really did but that would not lead to a collapse or anything. You see, with a lot of people already being aware of August 2013 being a critical month, new energy was added to the market, changing the harmonics. On top of that, the Fed was also aware of the market being so close to the plunge so they did their best to hold it up through a lot of money printing. Then at that time the market was also traded by “Big Dogs” to attract as many buyers as they could.
The current situation is fooling everyone one now. You might think, no war with Syria, no war with Iran, positive GDP numbers and the stock market will go to the Moon but here are the real issues, the debt ceiling drama and budegt deficit crisis. You see, the drastic measures to avoid hitting the debt ceiling will probably be exhausted in mid-October and also the budget deficit will likely soon go all over the press. In addition to the current economic issues, we also have a monsterous “New Moon “ coming on October 4th. Generally, October is going to be a difficult month for everyone and I suppose we are in for a rough couple of months.
Now I would like to turn your attention to the S&P500 weekly chart.
As you see, I have plotted the 20-day moving average to indicate the moving support and resistance levesl. Not that I apply such method in my market analysis but I am simply doing this to indicate a very important support level at 1656 area on the weekly chart. You see, the prices will likely soon hit it, then bounce a little bit. I assume it will be a weak attemp to make a higher high. Whether the market is able to make a higher high or not, the next attemp will be so weak. DO not let it fool you! All you would want to do is to wait for a “set-up bar” to form, then short the market without hesitation.
P.S. Another reason to expect a bounce is the goverment shutdown that happens (or doesn't happen... which is what I think will happen) that is set for September the 30th at midnight. That's Monday of course and there is supposed to be a vote that occurs on it at 8pm EST tonight (Saturday the 28th) while I'm writing this post. So kind of agreement should cause the market to rally. Maybe it is announced later tonight or possibly Monday after the close? Don't know which but once it's announced (and again, assuming it's positive) we should rally from the government remaining open for some future extended time period.
These 2 articles (http://finance.yahoo.com/blogs/breakout/easy-money-policy-lead-world-greatest-credit-collapse-164806633.html) and (http://www.cnbc.com/id/100950234) are clearly put out to mislead the sheep into shorting this market heavily. This means the FED's are running out of money and don't have enough power left to get the market up past the current high. They need more money and that money has too come from the bears as there's obviously no retail traders left in the market buying at these levels.
So how do you get more money? You put out articles on the propaganda main stream media outlets that speaks of crashes coming. The sheep read this and start shorting. The way the game is likely going to play out is something similar to the big head and shoulders pattern back in 2010. Everyone seen it and waited for the top of that right shoulder to short at around 06/21/2010, at which point they tricked the bears by breaking down below the neckline of that pattern around 1050 SPX. They went down to 1010 on 07/01/2010 before reversing and going back up to make another right shoulder on 08/04/2010. Then they dropped again to lure in more shorts thinking we were going to crash really big. You have to remember how bearish the sentiment was back then as we had just had a flash crash on 05/06/2010... so traders were looking for a crash even bigger to follow.
Well, it never happened as they tricked the bears by rallying for many months afterward as they "gamed" the huge head and shoulders pattern followers. I remember back then how main stream media puppets were even talking about it on a chart on TV. Naturally they were paid to do so as it was very important to get the sheep extremely bearish and heavily short. That was the money they needed to squeeze the bears and rally it up to new highs later that year. I see something similar happening again.
Basically I see a move down next week to around prior support in the 1650 SPX area. But, this rally we are currently in could go up higher before we start to drop. I don't see it happening on Friday the 9th though as I expect it to be choppy with up's and down's inside the triangle the market is in now. Then Monday we could see some final move up to end the rally. Don't know how high but it shouldn't go above the current high. Maybe it comes a few points shy of it... don't know? It could happy Friday of course but odd's say it comes on Monday. Either way it's a good short down to the 1650 level of support. Then expect a rally and probably more selling afterwards. That's too far out to look right now but some how I think it's going to be a choppy 3 weeks before they final some bottom that they decide to launch their rally from.
The ideal spot would be the 1560-1580 area and then back up to the 1670 area to make the top of the right shoulder where the left shoulder was the May 22nd, 2013 high. The head is obviously the current high at 1709 on August 8th, 2013. The tricky part he is to watch the news closely to see if the paid actors start talking about the head and shoulders pattern that I think is going to form. If so then when you add the stories now out about a 1987 style crash (by more paid puppets) which that media exposure of this future pattern I'll give it a 99% chance of it failing and rallying to new highs into October of this year when I think we'll hit 17,000 DOW and then CRASH around Legatus again!
We all know that the gangsters totally control the stock market 100% now and when it comes to the sheep (you and me) discovering the date in advance sometimes they are forced to make changes. Remember, if the sheep get short at the same time the wolves (the gangsters) get short then there's no one to steal the money from. They must have the sheep long when they are short as they need to have someone on the opposite side of the trade or else it wouldn't work. This is why the wolves will use their propaganda media outlets on TV (and on the internet) to lead the sheep in the wrong direction while they go in the opposite direction.
So when I see an article about a stock market crash that speaks of a well known forecaster named W.D. Gann that points to this August 16-23rd as the spot where the crash will start I have to wonder if it's not "planted" information to mislead the sheep again? It's different when it's on a small website run by one person as then it's likely put out to help fellow traders. But on a big site that a company runs you have to be leery as you don't know whether or not the gangsters control that site and therefore use it to steer the sheep in the wrong direction. I won't say for sure on it as Futures Mag isn't exactly as huge as CNBC, Yahoo Finance, or CBS MarketWatch... but it's still what I consider to be a "main stream media" site. Therefore we should be cautious now and be aware that the planned date could have been changed now?
Come the week of Aug. 16 - 23, the world’s largest Index, the S&P 500, will once again plummet. In an all too familiar fashion, it will drag down all other stock markets, superfunds and savings. No government or economic spin can ward off this descent, because nothing else but time governs the fluctuations of markets. Given that economic formulas and models are only pale reflections of the real world, as a forecasting tool, they can be utterly misleading. The way to gain insight into the forces driving the S&P 500 Index, and predict the Aug. 16 turnaround, is by consulting its graph and William Delbert Gann’s Square-of-9 (for why all Internet depictions of this Square are flawed refer to paragraph 7 below).
The graph’s coordinates X and Y, where X represents price and Y time, provide an untainted depiction of market behaviour. In addition to reflecting ‘price changes over time’, the plot of X and Y’s intersection points reflects also the perceptions, and thoughts, of those driving the ups and downs of price. Given that X is a function of Y, and Y is a function of X, and given that X is the volatile of the two, focusing on the forward procession of Y is far less challenging than the fluctuations of X (Figure 1).
Figure 1
There is reason to believe that when billionaire George Soros broke the bank of England by shorting the British pound on Sept. 16, 2002 and the AUD on May 08, 2013, the Y parameter and Gann’s Square-of-9 dictated his trades.
The first on the ‘to do list’ in analysing a graph is to determine the direction of the dominant trend. Figure 2 demonstrates that bearish trends manifest long down-swings with short upward corrections. And, as the market changes direction, its upward swings become longer in comparison to retreats.
The schematic in Figure 3 captures the 496 calendar day (cd) GFC decline period (Oct. 31, 2007 — March 08, 2009), and the recovery phase (March 09, 2009 — May 28, 2013). It shows that the S&P 500 Index’s recovery, which at the peak of May 28, 2013 measured 1542cd, in addition to being in an uptrend, reached an all-time high.
On June 25, 2013, the decline from the May 28 peak measured 28cd. It was 3cd shorter than its preceding 31cd upswing (Apr. 18 – May 28, 2013). Given this Index’s bullish trend, the sketch indicates that the forthcoming advance, which cannot be shorter than 31cd, will measure 52cd on August 16, 2013 (Figure 3).
Figure 3
To validate these dates, we turn to W.D. Gann’s Square-of-9, however, before proceeding to the Square, a word about identifying markets’ major peaks and troughs.
Even though pricewise the peak of May 21, 2013 was the highest point the S&P 500 reached on the chart, it was false (Figure 4). Given that it was followed by a 3cd decline and a 4cd advance, the longer swing, irrespective of price, is the one that determines the top.
W.D. Gann (1878 -1956) was 13 when he famously declared that “the future is not unforseen.” From the age of 24, the Sqaure-of-9 — a sequence of orderly numbers spiralling outwards in an anti-clockwise manner from the number 1 at the centre (Figure 5) — generated him $50 million from trading stock and commodity markets.
“I soon began to note the periodical reoccurrence of the rise and fall of stocks and commodities. This led me to conclude that natural law was the basis of market movements. I then decided to devote 10 years of my life to the study of natural law as applicable to the speculative markets and to devote my best energies toward making speculation a profitable profession.”
The numerals 1-9 forming the Square’s first ring inspired him to coin the device ‘The Square-of-9’, and its geometrical divisions, cardinals and diagonals.
The Australian mathematician, physicist and meteorologist, Trevor Casey — the first known man to unravel the Square’s mathematical structure since Gann — points out that all the Square’s Internet versions are mathematically wrong. In The Square Spiral— the Mathematics of Markets (BookPal 2010) heexplains that this Square is a spiral mimicking the Milky Way. As such, it unfolds from left to right, in the same direction as the galaxy, and each of its rings expands twice during one 3600 revolution. The first expansion takes place upon the Square’s north-western diagonal and second upon its south-eastern arm. Therefore, in contrast to the Internet versions, the north-western diagonal runs along the numerals 1, 2, 10, 26, 50…∞, and the south-eastern along 1, 5, 17, 37, 65….…∞. (Figure 5)
The other point he emphasises is that the Square is a calculator designed to measure time and should not be used in forecasting price levels. The 0.618 and 0.382 Golden mean proportions, known as Fibonacci ratios, are best for determining the support and resistance levels of price.
Figure 5 – The Square-of-9 constitutes a spiral of consecutive numbers unfolding outwards from the number 1 at the centre. Its numerals follow the anti-clockwise (left to right) direction of the Milky Way’s spiral.
Gann’s breakthrough came about when he observed that time-intervals typically adhere to the Square’s axes in that they commence and terminate upon them. A mature interval bounces off and culminates upon the Square’s same axis by completing a 3600 rotation from and back to the point at which the preceding interval ended. In cases when a swing terminates upon the Square’s opposite axis, at 1800 angle, it remains unfinished until such time it completes a 3600 rotation to the axis it had bounced off. Given that the present recovery wave took off the Square’s eastern cardinal, and must terminate upon it, the Square-of-9 makes is possible to forecast its maturity date.
Click to enlarge.
Figure 6
Sep. 01, 2000 — Apr. 12, 2003 = 922cd
[The nearest value is 916,easterncardinal - Figure 7]
Apr. 12, 2003 — Oct. 31, 2007 = 1694cd
[The nearest value is 1702,western cardinal – Figure 8]
Allowing that the March 09, 2009 trough terminated upon the Square’s eastern cardinal, on day 496 of the run, the subsequent 2009 – 2013 recovery wave must also terminate there. On August 16, 2013, when it measures 1621cd, it and the 496cd downswing will form a 3600 angle upon the Square’s eastern cardinal (Figure 9).
Figure 9 – Eastern Cardinal
Harking back to Figure 3, we see that the recovery wave’s top, on May 28, took place on day 1542 of the run and culminated upon the Square’s western cardinal (Figure 8). However, given that it bounced off the eastern cardinal (on March 09, 2009), its rotation has so far achieved 1800 — an indication of an incomplete move. Note that the peak of May 28, followed by a 28cd decline, touched upon the western cardinal on June 25 at a 3600 (1542 and 28, Figure 8). The final 52cd advance of the recovery wave will reach the Square’s western arm on August 16, 2013, where it will once again form a 3600 angle. However, its total span of 1621cd will fall upon the eastern cardinal at a 3600 angle with the preceding 496cd of the GFC crash.
For three millennia the pharaohs of Egypt relied upon large rocks carved with horizontal lines to record the height the Nile’s waters had reached during each day of the seasonal inundation. Indeed, Nileometer records collected from rocks scattered along the Nile are the longest data series we have. And although large chunks from the BCE data are missing, the records we have go back to 624AD, to the day Cairo’s Rhoda Island Nileometer became functional. The sheer length of this collection speaks volumes to their importance to the then pharaohs and scientists today. Ravaging floods and droughts turned the Nile settlers into brilliant problem solvers obsessed with patterns, symmetry and time sequences. Their effort yielded the Square-of-9 — Egypt’s most guarded secret, which tracked the changes in the Nile’s ups and downs over three thousand years.Subsequently, the pharaohs enshrined it in the Great Pyramid’s tiers where the block arrangement of each mimics the spiral of the Milky Way. When pulled from the number 1 at the centre, this Square morphs into a pyramid (Figure 10). With no data-processing technology, the Square and graphs sustained the pharaohs until Egypt‘s fall to the Romans in 48 BCE. One can only speculate how much richer the pharaohs would have been had they also invented the stock market.
Figure 10 – The Square-of-9 constitutes an image of one pyramidal tier.
When asked “What is the cause behind the time factor?” Gann smiled and said: “It has taken me years of exhaustive study to learn the cause that produces the effects according to time. That is my secret and too valuable to be spread broadcast…” He died of heart failure in June 1956 and was laid to rest in New York’s Brooklyn Cemetery in a grave facing his beloved Wall Street. Just as the pharaohs departed leaving no clue to the secret they buried in the Great Pyramid’s tiers, Gann left us an image of one of its tiers, yet, withheld its layout and instructions of use.
So what do you get out of that post? Is Futures Mag planting a seed to the sheep to go short during that period so they can make money, or is it to mislead the sheep so the gangsters can make money as those short get squeeze and the market goes up to even higher levels then we think possible? If you got a lot of sheep short from them reading that post and the wolves are short too... then will the crash still happen? I just don't know to tell you the truth? Maybe the article wasn't put up on purpose to distract the sheep and just done by some honest writer trying to help? I will say that "if" it shows up again on some other "even more well known" website here soon then we will know for sure that there won't be any crash!
If I were a gangster and knew about this time period, which a whole lot of sheep also know about it, I'd change the plan up a little and start the move down either before that time zone or after that time zone. That way the sheep won't be able to make any money. If it starts early then the sheep will chase the move down looking for the bounce that never comes (until the bottom of course), and if you go past that date then we'll see a huge squeeze during that time zone to put the SPX up near 1780 area... and all the sheep short will lose their money and miss the crash move that will follow. Sucks either way in my opinion... but the gangsters aren't called that just for no reason! Their sole purpose in this matrix is to steal, lie, cheat, rape, murder, and smile while doing it (kinda like politicians do on TV).
Now I've probably talked too much about the number "eleven" and it's possible they change the plan due to the sheep figuring that out. Meaning that the market tends to have important turns (tops or bottoms) on "eleven" dates. The next 11 date is this coming Thursday, August the 8th as it adds up to 22, which is an eleven. After that we have the 17th but that's a Saturday so it's out. Then there's the 26th which is after Gann's time zone of August 16th-23rd. So you have to wonder at this point whether or not "they" will changed up the date and start early (like this week... possibly the 8th?) or start later (possibly the 26th?)?
There are 2 important levels of resistance overhead for the SPX, with the first one being the 1717-1720 area. Then there is the 1770-1780 zone, which should be the target should they go out past the Gann window. If they start early then I'd expect the first zone to be hit this week and then start the sell off before Gann's target dates. So for now I'm just going to be looking for the first zone to be hit and keep my ear to the ground for possible news that could scare the market. Like some planned false flag event or surprise whisper by Ben Bernanake about raising interest rates and/or stopping the QE. Anything that can shock the market like that probably won't be something we'll see ahead of time.
But we all have to do our part to watch as clues could come out before they actually pull the trigger and let her crash. Keep your eye's open on all the major sites for new FP's... especially huge ones! Remember that back when they had the flash crash they put out a FP the night before (around midnight) showing the downside target of 1065 (nice huh? 10[5+6=11] or 111... LOL). Clues are usually given but I'm only one person and can't catch it all. I depend on YOU to help me out so I can help all the other readers out too. Look for FP's and look for possible news events that could be the trigger. I think we are really close now so let's all keep our fingers on the trigger (meaning get ready and prepared to get short).
In my prevoius posts, I spent a good deal of time talking about certain turning points due in late May and the one coming up soon in August. Actually I described how the Venus cycle and Mayan calender work, explaining how the market was going to be weaker and weaker. I suggested that you folks not expect a big decline at first but give it some time and space until it gets weaker and weaker and now the real time of weakness has just begun! All you folks need to do is not to let those short-lived bounces and rallies fool you.
The truth of the matter is that this is exactly what the “movers and shakers” want from you. Actually, they all want you on the bull side now as it would not be so profitable if we (retail traders) knew exactly when to jump on board. As you all remember I also touched on Armstrong’s cycle work. You see, most financial markets analysts out there are already aware of the dates given by Armstrong’s pi-cycle work. Now with this being said do you really think that the market will turn based on his dates? Of course not!
With too many traders and analyst already being aware of such dates the stock market would never care to turn then. In fact, the pi-cycles exist... in the other words they have always existed, but the secret is that the harmonics change. It will not have to be the same thing for good. As time goes forward the things change... meaning more and more traders and investors get informed, therefore the harmonics become more complex.
But August is the month you need to watch closely...
Now the current move-down on the S&P is actually a correction to the sharp decline from June 19th to June 24th 2013. Meaning more short-lived rallies or sideways chops are in the cards. As soon as the prices resume rallying back up you folks need to realize that the market will not go to the moon. I suppose the next up-move will be relatively smaller or probably a failure, then it is going to be a time when a major top is put in. All you might want to do keep an eye out for set-up bars on weekly charts around August 16th And the full moon on August 20th.
Few days ago, I was talking with Red on Skype... talking about a potential short-term decline around August 7th and the market went down on 6th. Anyway, the top of the current long-term rally is going to be the beginning of a 3-year depression. And you folks would want to jump in as soon as you see the set-up bar.
From the looks of things I think we are going to create a nice "head and shoulders" pattern in the coming few weeks... of which the May 22nd high of 1687 is going to be the left shoulder while the coming new high will be the head. This new high I'm expecting should be around 1705-1710 spx and could hit this coming week. We have option expiration on Friday and usually by Wednesday most traders have exited their positions which means that not much happens on Thursday and Friday. Will it be the same this go around? I don't know? But I will say that any weakness we have early in the week will likely be bought up later in the week.
Since the move up last week from Bernanke saving the world was probably some smaller scale wave 3 it would stand to reason (not that "reason" ever works with the gangsters) that we could see a small pullback Monday or Tuesday for a possible wave 4... which then leaves only the wave 5 up to complete this larger move from the 1560 low. My target is around 1705-1710 and if I had to pick a day for it to hit I'd go with this Thursday because it's another "eleven" day. Do remember that this code can change anytime as the more people notice it the more likely they will be forced to change it. After all, if everyone knew the date of the high the gangsters couldn't steal your money. They need you to take other side of the trade that they are on, and if the sheep go short with the wolves it won't work.
Therefore they have to make this market look like it's going to 1800 or more so you'll be long when they are trying to get short. We should look for all kinds of bullish propaganda on the main stream media as you all know those people are paid to mislead you. The more they talk up the economy the more sheep they suck into the long side. Naturally they will be getting short while you are long, and of course they can (and will) do everything possible to make you believe that "this time is different" and the world economy is saved. Bullshit, but it is what it is...
Put simply I'm looking for that new high this week after a small pullback (or sideways movement) early in the week. If we don't see it Thursday then I'd look to the following Monday but a new high is surely coming... and very soon! Once the target is hit I'm expecting a drop of 50-80 points for the first wave 1 down, and then a strong wave 2 up that should end in the first week of August. I'd have to guess that August the 8th would be the high but that's simply based on numerology, as that's another "eleven" day. It works out nicely for the time needed to make the wave 1 down and the wave 2 up but the date is just a guess and nothing more.
So assuming we do top for the wave 2 up into the first week of August I'd expect the move up to come up shy of the 1687 high, (which is the left shoulder in the making), as if this is to make a right shoulder I believe it will be lower then the left shoulder and certainly lower then the head that should hit this week. This is forward looking and hasn't happened yet of course but if I were to think like a gangster I'd certainly make that wave 2 up a strong one. You want as many bears out of the market as possible before the start the nasty wave 3 (or C wave?) down to the target low area of 1440 spx. This area is based on the opening level for 2013 on January 2nd as I believe strongly that it will be revisited.
That day had the spx at 1420-1460... a strong 40 point rally to start the new year off. So I picked the middle of that range but obviously it could only go to 1460 or lower to 1420, which means we will have to be flexible in exiting our shorts when this happens. We also have further conformation that this area is the coming crash low as someone (thanks Rose for the update) on another site seen a FP on the SPY of 147... which is about 1465-1470 spx. We know from past history that FP's are commonly pierced by momentum before they reverse so it's entirely possible that we go deeper into the 1420-1460 zone before bottoming.
This move down should be ugly for the bulls and look like 2008 if it falls like I expect it to0!
Consider the possible high of the right shoulder around 1680 spx (again, just guessing here), which comes in the first week of August. Now look at the 2008 weekly chart and you'll see it only took 3 weeks to fall from 1255 spx (the week of 9/22) to 839 spx (the week of 10/6), so it's entirely possible that this move down could be completed by the end of August. However, unlike 2008 (which looks like a 5 wave pattern to me) I believe this whole move down from the coming new high will be a 3 wave pattern, or an ABC move. The key will be to figure out the top of the right shoulder in the first week of August... which will likely end up being a B wave up and not a wave 2 up.
Look at the January to August "head and shoulders" pattern that formed in 2011 as that's what I'm expecting again. In that case they put in the top of the left shoulder at 1344 the week of 2/14, then the head at 1370 the week of 5/2... followed by a slightly higher high (then the left shoulder) the week of 7/5 at 1356 spx. If this pattern happens again then the high we see for the coming right shoulder (in the projected first week of August, 2013) could be higher then the 1687 left shoulder high on May 22nd (which would certainly trick the bears again). Again, trying to figure out the top of this right shoulder that I think will hit in early August is tough as we don't yet know the top of the head... but it should be coming soon.
Until then let's just not take any short positions for more then a day trade as I suspect they will make the first wave down and the wave back up (into early August) filled with tricky moves. As far as the first wave down is concerned I'm guessing that it will backtest the falling trendline that connects the May 22nd high of 1687 to the June 18th high of 1653... which is around 1625 currently, but obviously it will continue to fall lower as each day passes. If it drops to 1600 by the last week of July then it will make a right shoulder on an "inverted head and shoulders" pattern with the 1560 low being the head and the 1598 low on 6/6 making the left shoulder.
This should be a nice tricky pattern to fool the sheep who see it and assume that the rally up from the right shoulder low will take out the coming high of 1705-1710... but we all know that's likely a distraction by the gangsters to lure in the longs before they tank it hard starting early August. The market is full of misdirection as in order for the gangsters to steal your money they have to have you on the other side of their trade. So I'm fully expecting this "inverted head and shoulders" pattern to make all the bears scared to get short and the bulls licking their chops anticipating another breakout move to the upside.
Ok, that's all for now... just focus on the first week of August (if you are a bear?) as the whole month is setting up to be a "Bear Feast"!
One More Big Move Down Before A Short Term Bottom...
Last week was one hell of a ride for the bears that got short by 2:30 pm Wednesday as Bernanke said nothing about giving the bulls more crack when the FOMC minutes were released. In fact he spoke more about taking some of their crack back from them, which needless to say... didn't make them very happy! I personally missed the whole move down as I was too busy with some other projects I'm currently working on right now. But hopefully some of you were short and benefited from Bernanke's gift to the bears. It was one of those moves that if you didn't get short ahead of time you would have missed the whole thing as they didn't give the bears any decent bounces to get short at.
It's funny how worthless elliottwave is when a big move like this happens. The whole move down looked like one large wave 3 instead of a 5 wave pattern. You can go back now and see some very small bounces in it and count out the entire wave pattern but when it was happening you would have likely missed them. So now it appears that we have bottomed for the short term and will likely be given one shot to get a short position from the expected early morning bounce this Monday.
So those of us that missed the first big move will get one more chance for the next big move down... which I think will happen all on Monday! If the first move from the 1654 high to the 1577 low wave a large wave A then Friday and Monday mornings bounce should be the larger B wave up. This should end by midday Monday and start rolling over in the afternoon session, which should scare every last bull to death when it takes out the 1577 low on the accelerated larger wave C down, which I believe will go hit 1536 pretty quickly. In fact with the momentum it's likely to gather I think it will take that prior low out and head toward the 200 day moving average around 1506 SPX.
Now I don't think it will get that low but I'm expecting a pierce of 10-20 points below the 1536 prior low just like the 1577 recent low went 21 points lower then the 1598 low back on June 6th, which was a day just like this coming Monday is going to be. What I mean is that June 6th, 2013 was Satan's 666 day and so will be Monday June 24th, 2013. How? Because June is the 6th month and 2013 equals a 6 for the year, which is 2 six's just right there. Then the 6th day of the month is an obvious six and then the 24th is too as 2+4=6. So this Monday is a 666 day and I fully expect them to use it to produce this massive larger wave C down, which will look like a mini-crash if we first rally to above 1600 somewhere first and then tank to above that 200 day moving average and below that 1536 prior low.
If there is ever a perfect day for them to do a mini-crash it would be Monday June 24th, 2013...
Will it happen like that? Hard too say obviously but the charts would certain support an ABC pattern playing out here. The question is simply how high will the larger wave B go up to and how long will it take for the larger wave C down take before it ends? The larger A wave down from the 1654 high to the 1577 low really happened in only 2 days and the larger B wave up started on Friday and could easily end sometime on Monday... making it only 2 days in duration. So can a larger C wave down happen in just one day? It certainly could I believe but naturally I can't guarantee you that we are going to have this mini-crash all on Monday and then end the larger C wave down. I'm only pointing out the possibility for this to happen all in one day is real.
Just be that this is not me calling for a crash on Monday but presenting some interesting facts that say it "could" happen. I'll simply be looking for that larger B wave up to end at some point in the first half of the day on Monday to get short at. If the market then rolls over for the start of the larger C wave down then it could take 2 days, 3 days or longer to end since the A wave and B wave took 2 days. But considering that any C wave is generally a "capitulation" wave where traders panic while getting hit with margin calls the possibility is real that it could all happen in just one day... and the best day would be Monday due to it's Satanic nature. We all know the people that control the market love their rituals and this is a perfect time to make a mini-crash happen in my opinion.
Regardless if this happens all in one day or not we should all just be focusing on finding the top of this larger B wave up so we can short it in front of the larger C wave down that will follow. If it takes 1 day or 1 week to end the C wave it shouldn't really matter as the goal is to just be on board for the ride. Looking at the charts we all see that big gap at 1628.93 to 1622.54 SPX that stands out like an obvious target. While it's common to fill gaps it's not common to expect it to happen this soon. Maybe they only go to gap window at 1622.54 and don't make gap fill at 1628.93 until weeks from now after we first bottom below 1536 and rally back up in the first few weeks in July.
Looking at the charts I can draw a trendline from the 5/30 high of 1661.90, connect it to the 6/10 high at 1647.72 and it will point toward about 1625 area (and falling of course) on Monday. This means that it could fall to the 1622 gap window level by early Monday, and should stop the bulls on the first hit. This implies that gap fill won't likely happen and the best the bulls can hope for is gap window. From a Fibonacci level we have a 50% retracement at 1616 and a 38.2% at 1606 SPX. The 1606 level seems a little bit too shallow if they want to really trick the bulls and get the largest percentage of them trapped before a nasty C crash wave down. Plus you need to get the bears out of their short positions for the C wave down to really gain momentum. Therefore I'd think the 1616-1622 area will be the best spot to get the most bulls long and the most bears out.
The only major concern here is that I could be focusing on the wrong idea... meaning that there is probably more bulls trapped long then bears to squeeze. That means the lower target of 1606 for the 38.2% Fibonacci level might be all we get? The overnight futures Sunday night and Monday morning should give us a clue I think. I'd like to see a strong gap up open to get the rally going strong so we can hit the higher target range of 1616 (the 50% Fib. level) to 1622 the gap window and trendline of resistance level. I'd love to short from that zone as opposed to only 1606 but the market will give us whatever we are allowed I guess.
We should also watch the VXX closely for clues and when it gets close to it's gap window of 20.91 we should be topping on the SPX at the same time. Maybe it even goes and fills it's gap at 20.12 and the SPX only hits gap window but we should watch it closely for clues. Then the ES also has an important trendline to watch, which comes in around 1620 (and falling of course) that would probably match up with the 1622 gap window on the SPX. This is the ideal place to short the market on Monday should it rally up that high? We may only get the 38.2% level around 1606 but I'm leaning toward the 1622 zone.
Regardless of if this happens all on Monday or not the odds of getting through the 1620 area "downward sloping resistance" line on the ES on the first hit is very low. That's about 1622 on the SPX which is around gap window and also the lower rising trendline from the broken channel the market fell out of last week. When you have 2 trendlines meeting around the same spot along with a gap window level you have triple resistance there. You also have the 50 day moving average around 1618 and the 50% Fibonacci level at 1616 to deal with too. All of those factors tell me that the zone of 1616 to 1622 is going to be very, very hard to breakthrough on the first hit.
After the market finishes this C wave down I expect 2-3 weeks of choppy up and down action into late July before topping for a final "lower high" then the 1687 top on May 22nd, 2013. From that area I'll be looking for the next crash wave down that should make August one very ugly month for the bulls and a feast for the bears. I'm expecting the 1420-1440 area to be the downside target for that huge sell off. Then we should rally the rest of the year if all goes as planned.
I know it has been long time since I last posted on the blog since nothing much And serious had happened. I recommended everyone not go short until late May Or early June. Red and I both agreed on a possible top on May 22nd-23rd. Now I am now going to explain whether it will be a major reversal or not.
In my previous posts I talked about the “law of vibration” and cycles and if you believe we humans are not exempt from the “natural law” you will absolutely believe that there is no randomness and imbalance in the behavior and emotions of the mass. Every living thing in the universe vibrates, thus moving in a cyclic motion. As a matter of fact cycles are progressional series where everything in nature combines in certain ratios (not only fibonacci numbers and golden ratios) to form a progressional series.
Actually, the ancients were truly aware of that as well. You see, the Mayans conceived of time and human history as moving in cycles small and large (It actually reflects the wheels within wheels). In the modern world there is only a single calendar to keep track of our annual solar circuit, while in ancient times the Mayans used variety of calendars. One of the most significant calendars is called the “Long Count”... and was so peculiar as it had no start date! The Mayan based their Long Count on what they referred to as “Birth of Venus”. It was based on 104 -year “Venus-Round Cycle” ( two calendars of 52 years), which was really an important ceremonial event for them. It was referred to as the point in time when all of their sacred calendars were realigned with the Cycle of Venus.
Now before I go on to explain more about the Mayan sacred calendars and such I would Like to touch on the brilliant work of Nikola Tesla who is the greatest genius of 20th century... not Einstein but Tesla! He studied Electromagnetic's and Electrophysics. Using Egyptian secrets and numerology he created free energy ( it was suppressed by the Illuminati), and also invented a flying saucer which could fly around based on its own energy. Actually many of his ground-breaking inventions were never released to the public and later he was called a “mad scientist”.
Anyway, historically he is known to have repeatedly said: If only the world knew the magnificence 3,6 and 9. He was truly obsessed with the groups of 3s, 6s being second and 9s being third. Only a few people can understand that he was actually referring to the “secrets of Egyptians” and I have somehow learned and found out that Tesla’s 3s, 6s and 9s nearly include everything in the nature. He also said that... and I quote: “Electricity came to me in a vision whilst I was looking at the sun. I saw four winding's wrapped around spaced at 90 degrees to each other”.
Now applying Tesla’s approach we have four quadrants in a circle which is representative of a cycle, unity or completeness, all spaced at 90 degrees to each other. And at each 90 degree, we have the number 13 or 4*13=52 (the number thirteen was a root number for the Mayans). If I link it all to the cycles of Stock market we will find out that it has been responsible for many of the biggest panics and bottoms since 1915... such as 1962, 1974, 1987, 2000 and 2013.
If you examine the cycles in charts you will discover that the length of the cycle varies a little, which is due to some natural phenomenon. The one in 2013 peaked in late May and we are about to see the consequences of it soon. But you should not expect a very large decline at first. First, the current uptrend is going to become weaker and weaker... then in late July or early August we must crash! Therefore in August and September you should totally be short.
Now if you we use 13 as the root of the Mayan calendar system we find the following number sequence: 13, 26, 39, 52, 65, 78, 91, 104 . If you notice, this number sequence is an octave consisting of eight tones and seven intervals. The truth of the matter is that we have seven “overtones” which have arisen from the “fundamental tone”. With that said, each number in the sequence can also be an octave. I have already explained that if you consider a circle as a unity of 52-year round cycle each of it's 90 degree-quadrants now belongs to the 13-year cycle. The 2/3rd's of the cycle which is perfectly “the major sixth” (in diatonic scale) is located at 60 degrees... 13*2/3 (0.667)=8.6 years.
Every cycle has their own building blocks and the 8.6-year cycle is one of the building blocks of the 13-year cycle in the stock market, (as rediscovered by Martin H. Armstrong). He is someone who could read the cycles better than Illuminati He made money when they lost money in the market, and soon they were mad at him and had him put in prison for seven years for manipulating the financial markets. He uses the pi (3.14) cycles.
To his amazement he discovered that there are 3141 days within the 8.6-year cycle. Google his economic confidence model, but you will find out that the amount of information on his work is really limited. If you break the 8.6-year cycle into smaller cycles you will then have four 2.15-year cycles. You might want to examine these cycles back in time... particularly from the year 2000 on. Again, the length of the cycles varies a little.
To sum up... due to Venus 13-year cycle the market is going to be weaker and weaker until the energy of the current uptrend is completely drained. Then we will see a series of panic declines. So the period between now and early August should raise caution.
Please feel free to get in touch with me with your comments.
May you profit handsomely, Ali
afiroozi (at) rocketmail (dot) com
P.S. Finanial markets grow both in time and price, and I have only talked about the timing aspect of the market in the article.
Last week I was expecting some type of wave up (a wave 5) to break the triangle but the market was too weak and it never happen. Hopefully most of you were already short and held through the rally's up and down. I would have loved to have seen that wave up to get short again at but missed it. Such is life I guess? So now we have a falling channel going on and from the looks of things I'm going to speculate that the next big move down day will be this coming Thursday, June 6th. Looking at the charts I see prior support in the current 1630 spx area from back on the 8th, 9th, 10th, and 13th of May. And since we are quite oversold on the short term I'm thinking that we'll dip down lower Monday morning and then chop back up a little throughout the rest of the day... basically going nowhere.
In fact, Monday should close down slightly or up slightly but nothing big either way. Then Tuesday and Wednesday I'm expecting more of the same to happen, but by the close on Wednesday I think we'll hit the top trendline on the falling channel. It should be around 1640 spx area by then I believe and by the time it hits it I think the short term charts will become overbought again and allow for another big down day to happen on Thursday with the target being the break of 1600 to fill the gap at 1597 spx. So an intraday low as deep as 1580 is possible (don't expect it though) but they should recapture the 1600 level by the end of the day I suspect.
Then we should bounce back up nicely on Friday I think and probably into Monday the 10th, with Tuesday the 11th likely ending the bounce. Remember, I think we are going down to retest that 1536 prior low and I think we'll hit it by Friday the 14th at the latest. The old rule of thumb is that "they" (the market makers... aka gangsters) usually put in the low the Thursday or Friday the week prior to the monthly option expiration, which is June 21st... meaning either Thursday the 13th or Friday the 14th should be the low for this whole move down from the May 22nd high. I can count the wave better now and I think this is what we have coming...
The Largest Wave ONE down should be from 1687 spx to around 1536 spx. Inside that wave are 5 medium waves with the wave 1 down being from 1687 to 1636, and then back up to 1674 for the ABC medium wave 2 up. When that ended we started the smaller wave 1 down inside the medium wave 3 down. I suspect this medium wave 3 down is going from 1674 to just under 1600 to fill the gap. It has 5 smaller waves inside it and the first wave 1 down was from 1674 to 1640, and then a smaller wave 2 up to 1661 spx. So what we seen Friday was a smaller wave 3 down inside the medium wave 3 down. There is still more room to go down yet on that smaller wave 3, and looking at the chart it could go as low as 1620 on Monday.
Then we should have a smaller wave 4 up (inside the medium wave 3 down) on Tuesday and Wednesday which I think will hit the top trendline of the channel in the 1640-1650 area. Hard to say right now as the trendline will go lower every day, but 1640-1650 is the estimated zone that the smaller wave 4 up should hit that trendline and stop. This leaves the smaller wave 5 down inside the medium wave 3 down still left to go, and that's the wave I think will hit the 1600 area and end at. Then we should start the medium wave 4 up into Friday the 7th and Monday the 10th. It's likely going to be an ABC wave up so it could rally on Friday for the A wave up and down on Monday for the B wave down, with a final C wave up to happen on Tuesday the 11th... which would end the medium wave 4 up.
Next would be the medium wave 5 down that should last the rest of the week and take us to the 1536 area by Friday the 14th to put in the low for the larger wave 1 down from the May 22nd high at 1687 spx. After that we'll probably have a lot of chop the rest of June and into July for the larger wave 2 up. This means that late July and early August we could be seeing a larger wave 3 down start like Ali is talking about in his update post above. Catching the smaller wave 3 down, inside the medium wave 3 down, inside the larger wave 3 down will be a bears dream! I'll do my best to try to figure it out but do keep in mind that I get the counts wrong sometimes (like last week with that wave 5 up not happening), so always use your own judgement.
Ok, that's about all I can think of now so I'll see you all on the blog in the comment section...
Red
P.S. Here's a nice read from another blog that covers some of Martin Armstrong's predictions...
Martin Armstrong is undoubtedly one of the greatest cycle theorists of our day. His predictions include the 1989 peak in the Nikkei market to the day, as well as the 1987 crash and 2007 top in the U.S. markets. Armstrong's most famous cycle is 8.6 years, or pi*1000 days (3141 days). In Armstrong's article The Business Cycle and the Future (1999), he states:
I began with the very basic naive approach of simply adding up all the financial panics between 1683 and 1907 and dividing 224 years by the number of panics being 26 yielding 8.6 years. Well, this didn’t seem to be very valid at first, but it did allow for a greater amount of data to be tested compared to merely 3 waves described by Kondratieff.
...The issue of intensity seemed to revolve around periods of 51.6 years, which was in reality a group of 6 individual business cycles of 8.6 years in length.
...The total number of days within an 8.6-year business cycle was 3141. In reality, the 8.6-year cycle was equal to p (Pi) * 1000
In Armstrong's article, he further subdivides the 8.6 year cycle into four 2.15 year intervals, and lists several dates going into the future. Let's find out what is going on with the planets on these dates.
The Economic Confidence Model in 2.15-year intervals
To me this update tells me that a stock market crash is coming this year and next year just like the 1929 crash happened first and then in 1932 (when it bottomed) President Roosevelt devalued the dollar overnight by telling everyone to turn in their $20 dollar gold coins, followed by a revaluation of $35 dollars for the same gold coin after the bank holiday ended. This means they are going to crash the stock market first and probably bottom in the 400-600 SPX area within the next 2 years and then they will close the banks for a week or so to revalue the dollar with a 40% haircut. Then once they reopen the banks every dollar will worth that much less, which also means that gold will soar by just as much on a percentage basis.
This means that YOU and I have only the next 24 months or so to make as much money as possible from this coming stock market crash. Then we are going to see massive inflation from this dollar devaluation and we'll also see a HUGE Bull market start that will take the Dow up to crazy highs like 30,000 or more! On the short term I see gold continuing down to "possibly" hit the FP of 939 (or the 935 FP) for a bottom followed by a rally to over $3,000 per ounce by the end of 2014.
(Side Note: Lindsey Williams stated the the cure for colon cancer is carnivora, and it's can be bought here 866-836-8735. I found this site on the internet selling it... http://www.carnivora.com)
Going back to a much shorting term I still see a very important high coming this May 22nd as the preferred date with possibly May 29th being the high. After that I'm expecting a 200 point drop in the SPX to start the first shock in the stock market. This will only be a small crack compared to what I see for 2014 as after a final high in February I see about a 1,000 point drop in the SPX by the end of that year! You will have the opportunity of a lifetime to make a huge chunk of money on this coming drop late this May and early June and then turn that into a million dollars or more in 2014 when the real crash happens!
There are many, many pieces to the puzzle coming together now and I'm more certain then ever that we are going drop hard starting this late May and into early June.
A new article out about the latest Bilderberg meeting shows us some interesting timing and dates. While those meetings are being exposed heavily now by people like Alex Jones and the now deceased insider reporter Jim Tucker the Legatus meetings aren't yet known to most of the "red pill taker" crowd. Only Reinhardt and myself are really talking about the connection they have to the stock market and with the next meeting set for this May 23rd-25th, 2013... followed by a Bilderberg meeting June 6th-9th (re-updating a prior date of June 9-11), one has to wonder what these Satanist Reptilian's have planned for us sheep? Here is that report...
American Free Press received e-mail from Grove Hotel staffer, apparently confirming that Bilderberg 2013 will be going down near Watford in the United Kingdom from June 6-9.
AFP’s Mark Anderson reports that he received an e-mail from a Grove Hotel employee, apparently confirming a UK-based Bilderberg meeting this coming June. Anderson writes:
“An email reply to AFP from a Grove staffer and a check of the hotel website’s calendar confirmed the hotel is booked solid June 5-9. The Bilderberg meeting itself, by all the latest indications, is to take place June 6-9. This updates a recent AFP report that stated England was likely the general meeting location but that the meeting would be held June 9-11. At the time, the hotel where the meeting was to be held was not yet known.”
Indeed. In recent weeks there have been several indications pointing to a probable UK Bilderberg meeting. As I recently reported, a call handler at the Hertfordshire constabulary confirmed that the Grove Hotel, both the surroundings and the Hotel itself will be cordoned off by the local Hertfordshire constabulary in a “security exercise”. The exercise, by the way, is planned exactly at the time that the Hotel, according to its employees, will accommodate a “high profile” international group- booking all 220 rooms. As Anderson notes in his article:
“The hotel’s location, some 18 miles outside of London, provides easy access to and from Heathrow Airport. Its rural setting is well suited for Bilderberg’s usual ring of armed security to keep pesky reporters and activists at bay.”
Thanks to many citizen-journalists probing the Hotel and local Hertfordshire constabulary it is also becoming obvious that an elite club will indeed descend on the area at the beginning of June. According to a recent vigilant posting on the Planet X website, an employee of the Grove Hotel has revealed that the hotel’s golf course is booked out by an “American Group” from June 6-9. The commenter, pretending to be interested to reserve the golf court, no booking is possible on those dates:
“No that is not possible during those dates because the private American Group Organizers have requested that they have full exclusive use themselves”.
The “American group”- comment is interesting in more than one respect. Not only does this slip-up by a Grove employee confirm the grounds (Hotel, all its facilities and the surrounding lands) are off-limit to the general public (meaning anyone not holding key power positions), it also suggests that the organizers are predominantly American. When we take a look at Bilderberg’s current steering committee we find no less than 11 Americans among the 34 members (including David Rockefeller). Because the event itself is “international” in nature, concerning “high profile” individuals – we now have further indications the UK will host this year’s Bilderberg conference. Adding this little information-droplet to the others, spilled by employees of the Grove Hotel and the local constabulary, the Hertfordshire venue is increasingly likely to be the spot where the annual Bilderberg conference is set to take place.
What I find interesting is this old clock from the Simpson's episode showing various combinations that could be pointing to a date of some nuclear explosion. We could have 11-6 (November 6th) or 6-11 (June 11th). Other interpretation have been done of course and no one has yet to figure out what (or if?) this really is a signal from the gangsters of what's coming in the future. I just find it interesting that the original date for the Bilderberg meeting was June 9-11... which looks like 911 to me. Now it's set for June 6-9, which is just before a possible reading of June 11th from the Simpson clock. That, along with a Legatus meeting just prior between May 23rd to 25th, has got to mean something.
I'm not saying that anything will happen (like a false flag nuke going off in some part of the world) but it's certainly worth noting and keeping in the back of your mind. All move the stock market are planned by these Satanist months and years in advance so trying to forecast it isn't that easy to do. But they give us sheep signals to help us (not really, more like "because it's some sick code of ethics they must obey"), and it's up to us to figure them out.
I'm kinda jumping around here as I'm writing this post on Sunday with multiple breaks throughout the day... meaning when I come back to write more I my decide to talk about a different subject. Right now I want to talk about next week and what I'm expecting to happen. I'm thinking that we had some kind of wave 3 up happen last Friday and into the close we started a wave 4 down. I'm not sure if it ended by the close Friday or if it will take all day Monday to complete, but once it ends I'm expecting one more move up to the 1630-1650 SPX area to end this very long rally and allow the first wave 1 down to start. So if we hit this zone by Tuesday then I'll be looking to go short. If it drags out a little longer then I'll just wait as I know it's very nearly done.
Then the first move down should find support around 1600 as that was prior resistance. It should end the first wave 1 down if it stops there and allow for a choppy move back up into May 22nd for the wave 2 up to complete. Then the wave 3 down should start and drop 150-200 SPX point in a period of about 18-20 calendar days (based on prior history of similar moves). If the wave 1 down breaks 1600 and goes to the next level of support around 1550-1570 SPX then the move back up for the wave 2 should be pushed out to the secondary date of May 29th before it ends and allows the wave 3 down to start. This is really a tough call here as I don't know when we are going to hit the top zone of 1630-1650, or how low the first wave 1 down will go.
Each move should take a certain amount of time based on similar moves in the past but telling you the exact date right now is hard too do. I'm estimating that we'll hit the top zone sometime this week and then start the first wave 1 down. That wave could last as little as 3-4 days if it's only 40-50 points down or 5-7 (trading) days if it's 80-100 points. From there we can calculate the move up to last 4-7 days as well, which should tell us if the high is going to be early on May 22nd or later on May 29th. We know from past history that many of the turns are centered around Legatus meetings and this coming meeting is dead set in the middle of those two "double ritual eleven" days happening on May 23rd to 25th.
Looking back at last year we see that they had a Legatus meeting on April 30th to May 2nd and the "eleven" date back then was May the 1st (05/01/2012 equals 0+5+0+1+2+0+1+2=11). This year we have an "eleven" date just before and after the meeting and both dates this time are "double elevens". You see, when you add up all the digits you get what I call a "yearly" eleven date. But there's also what I call a "daily" eleven date where just the day of the month equals eleven. So every month has 3 of those dates as you obviously have the 11th, but you also have the 22nd as it's a master number (just like 11) because it's a multiple of 11... meaning that all 11's, 22's, 33's, 44's, 55's, etc... are all master numbers and not to be added together like all other numbers are. That means that 11 isn't 1+1 to equal 2, but simply remains as "eleven". The same thing for 22, as it's not 2+2 to equal 4 but remains as twenty-two.
The only other day of every month that equals "eleven" is the 29th as 2+9=11. So every month has the 11th, 22nd, and 29th as "daily" elevens, and then there are the "yearly" eleven days where all the digits add up to eleven. So this coming May the 11th is of course a "daily" eleven but it's also a "yearly" eleven, whereas all the digits add up to 22, which is a master number and equal to 11 (0+5+[11]+2+0+1+3=22). The same thing is true for the 22nd as it adds up to 33 and then the 29th adds up to 22. All 3 dates are both "yearly" and "daily" elevens... or double elevens.
Since many (not all... maybe 30%?) of the important tops occur on ritual eleven dates it's very important to monitor them and look for a high on them. This means that either the 22nd or the 29th should be the high for the wave 2 back up as the wave 3 down is a very important date and will likely be on a ritual eleven day. Nothing is written in stone of course but I'd pay close attention to those 2 dates. Between now and then it could be choppy as they make a wave 1 down and wave 2 up. My plan is to take a small short when we hit the 1630-1650 area to ride down that wave 1 to where ever they take it to. Maybe 50 points or maybe 80 points? I don't know which but both are worth shorting I believe.
That's about it I guess as we are all just waiting patiently for the right time to attack...
Hitting the old 2007 high seems certain now, and after it's hit a several week pullback should follow...
The spoken (but of course not guaranteed) rule is that the longer the period between one prior top and it's double top in the making the stronger the resistance. Therefore the odds are much higher for a pullback before making a third attempt to pierce through that double top and make a new all time. As for how far and how long the pullback will be is usually based on how overbought the market is on the various time frames. Looking at the daily, weekly, and monthly charts one could argue for a several week pullback versus just a few days... and I personally concur with that logic as well.
I'm going to present two different scenarios here but both have the market pulling back next week. Each scenario is just the longer term wave count but in reality the only difference in the price level of the market and not the expected periods of the highs and lows. Since I'm not an Elliottwave expert I'm going to study the charts of someone that is, and input possible future wave counts with likely date periods for the highs and lows. One of the counts puts a new all time high next year and the other puts it this year. But both counts still give us the important turning periods.
Scenario One...
First, lets go over what I said in the last post. I proposed that we would top in the first week of April and then sell off for several weeks toward the end of the month. I was thinking that wave down was going to be a wave 1 down with the move back up starting in late April and likely ending in late May (with the 22nd being my target date) being called wave 2 up. Then a wave 3 would follow which would be one very nasty panic wave of selling. This was also based on the high being hit in the first week of April to be nicely above the prior all time high of 1576.09 SPX in 2007. My thoughts were that we'd do some type of ritual number like 1666, just like they bottomed at 666 in March of 2009... and had an intraday low of 333.33 on the day that the high was put in for the year of 1987 before the crash that followed later that year (that date was 08/25/1987).
While hitting 1666 would probably be very obvious to any "red pill taker" today (and even some "blue pill takers" would figure it out too) the odds of that happening on Monday, (the ritual "eleven" date) seem very slim with the SPX closing at 1569.19 on Friday. This leaves the next ritual "eleven" date of April the 10th for that possible high happening. But I just don't think that's the way it's going to play out now. I've been doing more studying of what happened in the past and I now am going to give that scenario low odds and go with the second scenario that I'm going to go over now.
Scenario Two...
I was reading Tony Caldaro's blog last week (which I haven't done in a very long time) as I wanted to get his Elliottwave count on all the various waves and see if I'm missing something. Sure enough I did indeed overlook something (assuming history repeats itself?), which I didn't go looking for until I seen Tony's wave count was different then mine. Since I'm not an expert at EW theory and Tony is I decided to go back in the past to see if it was possible that his wave count could play out (and to see if it had happened in the past as well).
So what is his wave count and how is it different from mine? Of course I'll go over that in the video but let me see if I can explain it here for you as well. Tony proposes that we are in an "intermediate wave 3" up right now inside a larger "major wave 3" up... inside an even larger "primary wave 3" up. His count would suggest that we still could drop for an "intermediate wave 4" down anytime now, which I suspect will be on Monday when (and "if"?) we hit the double top zone of 1576.09 spx (hopefully pierce it by a few points), which could last 2-4 weeks toward the end of April. This then leaves the wave up into the late May Legatus meeting to be a final "intermediate wave 5" up and not a wave 2 as I previously thought.
This also means that the current coming double top zone must be broken for that to be a valid "intermediate wave 5" up. I'm thinking we'll hit 1610-1630 spx around that May 22nd ritual date now, which obviously won't be the wave 2 up like I previously thought but the final 5th wave up (intermediate) inside a larger "major wave 3" up. This would setup the first wave down from that May peak to be an "intermediate wave 1" (or wave A I guess?) inside a larger "major wave 4" down. The start of major wave 3 up was 1266.74 spx on 06/04/2012, which leaves a lot of room for big 5 wave (intermediate) panic sell off to happen.
But, here's where I disagree with Tony...
Tony states on his weekend post that he see's the top for the bull market in February or April of 2014... which of course there just happens to be a Legatus meeting then too! Coincidental? He also see's a high of 1650-1700 spx, which I see a ritual number like 1666 spx, so we agree on those two points. But I don't understand his wave count that he has laid out because it would project the market way higher then this 1650-1700 top area. Let me explain... if we follow the plan with his wave count into May and put in a high of 1610-1630 that will complete the intermediate wave 5 up and the major wave 3 up then the first of a suspected 5 wave (or 3 wave) intermediate wave series down should start. This also starts major wave 4 down, which again needs to stay above 1266.74 to be valid... but that leave major wave 5 up that needs to take out the late May high of major wave 3 (thinking 1610-1630).
So if that happens to be his 1650-1700 target just how do that end the bull market? That only would complete major wave 5 up inside primary wave 3 up. Where does primary wave 4 down and primary wave 5 up come into play? My speculation is that primary waves one, two, and three are really A, B, and C and there won't be a 4th wave down and 5th wave up, as if there were the high would be closer to 2000 spx... and I just can't see that happening. The other alternate is that the major wave count is wrong and the move down in May starts primary wave 4 down and that top completed all the major waves up. Then we could go down as deep as 1074.77 to make a primary wave 4 down and back up to 1666 for primary wave 5 up.
This lines up with Tony's call for a final high in early 2014 but ironically doesn't match is wave count? I'm not sure if I'm missing something here but I've went over this many times now and I can't make the waves match up with his target for the end of the bull market... not unless you change the label's of the current waves. But I guess the wave patterns aren't really that important as the most important thing here is to catch the turning points correctly so we can all make money from the moves.
Therefore, I still calling for an important top this week with April 1st being the most likely date...
Then a 18-20 calendar day sell off seems likely... if history repeats itself. Followed by a rally into the next Legatus meeting May 23rd-25th, 2013 with the most likely topping date being on May 22d (which is a double "eleven" date). Whether that date is accurate or not remains to be seen... and some how I wouldn't doubt that it won't be accurate just because I've been talking about it so much lately. If the gangsters read this blog (and I"m sure they do) then they will most likely change the date just so I'm wrong. So just take that date as potential date and not something written in stone. Many, but not all, important tops are on "eleven" days... which I'd guess at 30-40% of them are. That's actually pretty high considering that they could land on a one, two, three, four, five, six, seven, eight, nine, or ten day just as easily... which when adding in the 11th day you have odd's of only around 9% for each number. Therefore hitting "11" 30-40% of the time isn't normal... unless of course it's planned. 😉
Backing up a little, I mentioned that I looked back in the past to see if Tony's wave count every happened or something similar... and something sparked my eye. When the high was put in on 03/24/2000 of 1552.87 spx it was truly and "all time new high" that there wasn't anything even close to it in the past to compare it with. That was the intraday high and the closing high was 1527.57 which was revisited on 09/01/2000 when an intraday high of 1530.09 was reached but failed to hold and closed at 1520.77 spx. That was the last time the market would see that level until 2007 came along.
Seven years after that 2000 top the market hit 1555.90 spx on 07/16/2007 with it's intraday high. It couldn't hold that high, (which was just 3.23 points over the intraday prior high), and closed at 1549.52 that day. The market then dropped Tuesday and continued into Wednesday the 18th for the first wave 1 down. It put in a nice bottoming tail on Wednesday and rallied hard on Thursday the 19th to hit 1555.20 as an intraday high. That move completed the wave 2 up which was followed by the start of the wave 3 down on Friday the 20th. That move lasted for 18 calendar days until wave 3 down bottomed on Monday 08/06/2007 with and intraday low of 1427.39, or 133.51 points in total from the top.
Then you had a wave 4 up that lasted 3 days topping that Wednesday the 8th, and then a wave 5 down that lasted until an intraday low of 1370.60 was hit on Thursday August 16th, 2007. The total 5 wave move down was 185.30 points in total and 28 calendar days. What's important to see here is that a double top that happens after 7 long years did indeed produce a very nice sell off. That's why I'm also expecting a similar type of sell to start this week when we hit (and slightly breakthrough the 1576.09 double top from 10/11/2007.
This all leads me up to May 22nd for another all time high and sell off to follow...
I'm not going to go count all the waves made prior to 07/16/2007 high (from 2000) as you can study Tony's charts for that... or a dozen other EW chartists. The thing that caught my eye the most about this period was the fact that after the 2000 high was broken the market did sell off, but more importantly it recovered to make again another new "all time" high on October 11th, 2007, which was 1576.09... a 20.19 point move higher then just a few months back. This supports Tony's theory that we are in intermediate wave 3, which if tops on April the 1st and drops for 2-4 weeks to make intermediate wave 4, then intermediate wave 5 up should be around 20 points (or so) higher then this early April high. And if that high is say 1580 then 1600 or more seem reasonable for late May. My thoughts are for a little higher move (1610-1630) as rarely do patterns repeat exactly.
Besides that, if you are going to have a 1929 style crash this time around (and I believe we are) then you should certainly go a little higher then everyone expects. If you get up to 1610, 1620, or even 1630 spx in late May then I'm pretty sure every bear will go back into his cave and give up for the year... only to miss the really nasty bear feast that should follow. Remember that this major wave 4 down can be as low as 1266.74 (the start of 3 up and the end of 2 down), which is over 400 points from where we are now. That could very well end up being primary wave 4 down (which is my thoughts) if Tony's count on the market being in a major wave 3 up is wrong.
I personally thing we will complete not only the intermediate wave 5 up in late May but also the major wave 5 up. I can't figure out how the wave count really could line up but it makes more sense to be starting Primary wave 4 down in May (to end in Sept/Oct 2013) followed by Primary wave 5 up into spring of 2014. I say that because I believe the sell off to start in late May will likely be faster then many will expect, much like the 2011 summer sell off was. I really see it as being a primary wave 4 down with primary 5 up into spring of 2014 ending the whole rally from the 2009 low. Tony's the expert here on EW counts and then only thing I can't figure out is those major wave's. For this to work out as I expect both the 3rd primary wave up and the 5th major wave up must end in late May.
Brief update from Ali...
Ali hasn't any new updates per-say as nothing has changed. But he did email a few days ago with more supporting evidence that this move down in May will be a very, very nasty wave... which is why I think it will be a primary wave 4 down (which can go as low as 1074.77 to still be valid), and now just a major wave 4 down inside a primary wave 3 up.
Uranus 17-Year Cycle... you may examine the cycle in detail back to 1897. We are currently in a 17-year sideways-to-down cycle that began in the year 2000. Each sideways-to-down cycle contains a mid-cycle panic as Uranus crosses the 36° harmonic, as it did in October, 2007.
October 2007 Uranus 36° Harmonic... This resulted in the corresponding top in the markets, leading to the 2008 crash. As a matter of fact, this cycle is interwoven with Venus-Earth 13-year cycle which is going to peak in late May. I assume that the bearish market could continue into early 2017, of course with some bumps on the road, for example we are going to have a major turning point in October of 2015 which could be a bottom.
Ali Firoozi Yasar
Let's also not forget that 2013 is the year of the snake and May is the month of the snake, which 2001 was (911 happened), 1941 was (pearl harbor), and of course 1929. Good things don't happen too much during snake years I guess? Throw in the all the stuff we have covered in this post and prior posts, and I think we have some really good odds here for a bear feast to occur. So I'll be looking to short the market Monday, April the 1st (will it be April fools day for the bulls?) if they hit the prior all time high of 1576.09 (and hopefully pierce it a little).
Obviously I'm not going to pass up a chance to profit from another 133.51 point drop like what happened from 07/16/2007 to 08/06/2007... not to imply that it's going to be that exact amount again, as that's highly unlikely. But never the less, a very nice move down should be coming over the next several weeks and I think it's worth shorting. History shows it to be accurate and the gangsters were manipulating the stock market back then too, just like they are today. The part that most bears won't see will be the rally back up from the late April low. I think they will all be expecting a wave 2 up (like I was in the last post) so they can catch the wave 3 down.
Unfortunately I think they will all be sadly taken for their money once again as the market will very likely repeat something similar to 2007 where the rally back up didn't put in a lower high but instead rallied up 20 more points higher and put in a new all time high. This will squeeze every last bear out of the market for sure as very few people will be expecting such a powerful rally to start in late April, early May. In fact everyone will be chanting "sell in May and go away"... only to see a rip roaring rally the first 3 weeks of May that will blow the tires off the bear bus! Those bears will be stranded once again just when they thought they were ready to go over the mountain and down into the bull abyss!
On top of that I also expect the bulls to miss a lot of that rally too as they will have some really big scars from the early April bear attacks. Most will be hesitant to go long and will miss the rally. Can't blame them really as after a new high is reached on April 1st who would believe that there would be another higher "new high" to come in late May? I'd go so far as to say that the bull will also think the rally up is just a wave 2 and become bears at some point trying to short it at some Fibonacci level all the way up... only to get squeeze themselves and propel the rally that much more. After that 1610-1630 level is hit I think there won't be any bears let on the planet... except for me (and those of you reading this post). 🙂
We truly live in a world of manipulation and deception.
The “ Illuminated” deliberately spread misinformation on numbers and symbols all over the internet, trying to mislead as many people as possible... especially conspiracy theorists! There are actually tons of false info and material on so-called “Masonic numbers” and “Symbolism” and one has to ask, what do these numbers and symbols really mean? What is their true purpose? Are they occult or scientific? Unfortunately, there is no clear and perfect reply to these sort of questions as no one knows the right answer and is not able to offer the true explanation.
As odd and mind-boggling as it may sound the Masonic numerology and symbolism are quite scientific... absolutely no occult! You see, they are truly aware of the secrets of science and being able to understand (and massively benefit from) the “Law of Equilibrium” and the "Harmony of Opposites". The truth is... their numbers and most of their symbols directly have to do with the big cycles of nature and of the heavens. The fact that matters is that it's a “forbidden knowledge” which is translated into wealth and power then used for manipulation and control of the masses.
Which is why they never ever reveal the secrets of the order and anyone studying and researching so is heavily suppressed. James Clerk Maxwell, the great 19th century researcher and pioneer who analyzed the behavior of Electromagnetic Waves, was heavily suppressed after he claimed and proved that the internal structures of the EM waves are 3-dimensional. Afterwards he came under a lot of pressure to simplify his equations (called quaternions). Consequently, Maxwell was rewriting and greatly narrowing his own treatise. Actually the second and third edition being studied at universities are not his original theory which was called “metaphysical mumbo jumbo” by Oliver Heaviside and others.
You see, secret societies have a lot of control over and power in various Scientific Institutions deflecting certain types of research related to hyperdimensional physics, free energy and anti-gravity. Nikola Telsa, a scientist (July 10th 1856, January 7th 1943), was an inventor and mechanical and electrical engineer. It is said that he was the scientist who had really discovered the secrets of numbers, which is why he made numerous groundbreaking discoveries and inventions in physics... many of which have never been released to the public.
For instance, he claimed to have invented a way to harness free energy which was truly free electricity and later he was suppressed by Rockefeller family as he was considered a threat to world energy and the wealth of Illuminati family. Generally there is ample evidence that any scientific effort which moves towards a discovery of the significance of numbers, harmony, and sacred 3-d geometries is being actively suppressed. Mainstream scientists like Albert Einstein and Steven Hawking were not allowed to reveal the true laws of physics and such ancient knowledge has been treated as an occult non-sense. More on this in my later posts.
Now the Stock Market...
There is not much new that I would like to talk about now as I did point to certain major and minor turning points in my previous post. The minor one is due on March 4th or 5th which could be a top (or bottom?). I also want to mention that it might be delayed for a couple of days as we are currently experiencing heavily manipulation in the market right now. Regardless, it's just a possibility and please remember that it is supposed to be a little pull-back (assuming the "turn" is to the downside and not to the upside?) and then the run-up might continue into late May when the great crash and a series of panic declines are due.
Well, it is generally true when we say “everything is consciousness” but actually this is the consciousness of smart money which dominates the financial markets. The patterns in the charts are the result of the energy being vibrated harmonically and the smart money is already aware of that for sure. In fact, they know exactly when to buy and to sell. It's a buy while the dumb money sells, it's a sell while the dumb money buys. You may assume now what they are doing currently is trying to suck in as many retail traders as they can.
The smart money is buying more and more in the market trying to attract as many buyers as they can as they want this market going up higher so badly... and then at the right point and at the right time they will sell short wiping out all of the buyers as the smart money has already leaned how to read the cycles accurately. As the old saying goes, if you can’t beat them... join’em! Meaning, with the current manipulation in the market right now this "minor turn" might not produce very much selling... so it could be wiser to just stay in cash until May (if you are a bear) or use any pullback to go long into the May top (following the smart money that is currently pushing the market higher).
It's funny how many blog writers out there claim to have such high accuracy ratings when they are a major Bull at heart. Try getting the Bearish calls right and then come talk smack! People who always make calls for the bulls have Bernanke's printing press to support them while those calling bearish patterns have to fight the PPT. Seems unfair doesn't it? Well it is unfair, totally manipulated and always in favor of the bulls... so get used too it. If I were a bull I could have forecast the last 3-4 years correct with a 80%+ accuracy rating as the market has been up 80% or more of all the days since late 2009 when I started writing about it.
Calling for bullish moves is as easy as shooting apples in a barrel with a shotgun standing 2 feet away... whereas making successful (and consistent) bearish calls are rare to say the least.So with that say, any bearish calls I make can easily be manipulated to "not happen" if the "operators" don't allow them. But I'm still about ready to make a bearish call based on the technical analysis of the charts, some common patterns, and little elliottwave. What I see on the TA side is bull flag on the weekly chart, a bullish cross on the MACD's for the daily chart, as well as the first positive close on the Histogram bars (again, for the daily chart). On the 4hour, 2hour, and 60minute charts I see "lower highs" coming on the Histogram bars which usually means a higher high on the actual price level... but also indicates a final exhaustion move too.
From looking for patterns there is an obvious "inverted head and shoulders" on those same time frames. The measured move up from this pattern is generally the distance from the left shoulder high to the low of the head, which is then added to the breakout point that happened today around 1522 SPX. So from about 1531 minus 1485 is 46 points which added to 1522 equals a move to 1571 spx... assuming the inverted H&S patterns plays out like the typical text book version of it does. And since TA's support the bulls right now I would expect this pattern to play out too... especially since you have heavy manipulate biased to the bullish side as well.
On the EW side of things it does look like we are in a 5th wave up with wave 1 starting at the 1343.45 low on 11/16/2012, then starting the wave 2 down after 12/18/2012 at the 1448.00 high. That wave ended at 1398.11 on 12/31/2012, which also started the wave 3 up that ended on 02/19/2013 at 1530.94, followed by the wave 4 down to end at 1485.01 on 02/26/2013... and that brings us up to the current 5th wave that we appear to be in now. Again, I don't trade EW but it is now supported by the TA's and the inverted H&S pattern... so I have to expect it to play out this time.
So what I expect is a move up to the recent double top of 1530.94 Tuesday morning and then a backtest to the downward sloping trendline that connects that high and slopes down to around the breakout point of 1522, which should be a little lower then that tomorrow as it is sloping down. I could see 1520 being tested before turning back up and then breaking through the 1530.94 double top by Wednesday. Since the measured move is only to 1571 spx, which is just short of the all time high of 1574, this supports the theory that we'll sell off there and after bottoming we'll rally back up into late May to not only retest that level but to breakthrough it and put in a new all time high before collapsing into the first crash wave.
My call for the final top is for May 22nd, 2013...
Why that date you ask? First off it lines up with what Ali see's with his calls for "late May" as being the final high that he see's in his cycle work. Secondly, it's a double "eleven" day. You see it's obviously an "eleven" because the actual date is the 22nd, and all master numbers that are dividable by 11 are simply considered to be 11's. That means 11, 22, 33, 44, 55, etc... are all 11's. But it's also a "yearly" 11 when you add up all the digits in the date, which equal 33, and that is not only the Free Mason "33rd degree" number but it's also considered to be an 11 as it's another "master number" and all master numbers are keep whole and not broken down. This means that 05/22/2013 equals 0+5+(22)+2+0+1+3 or 33!
The next possible date is the 24th as it's a yearly eleven as well because all the digits add up to equal 22 (05/24/2013 equals 0+5+2+4+2+0+1+3=22). But my thoughts lean toward the 22nd because it's also "daily" eleven and possibly having 2 eleven's makes it more important the Illuminati satanist? Then there is this juice little "event" they are having called a "Legatus Retreat" on May 23rd-25th, 2013... which I had to dig hard to find.
Now I don't know if this is considered a meeting like all the past meetings that they usually put up on their main page but it looks like one to me? Possibly all the exposure I've done concerning the connection between them and stock market turns has forced them to "not be so public" with their meetings and only publish them in their newsletter (http://bit.ly/insider-02-26)... which is still up on their site as of the date of me writing this post (03/04/2013).
Of course we'll need further evidence once we get to this point (like a new "all time high") but so far everything is pointing to this time frame. If this doesn't show up on their home page under their "conferences" link soon then we might be on our own without their help... or this constant exposure could have made them choose to leave it off the main page and they just slipped up by putting it on their newsletter link? We won't know until we get closer to that date of course, so for now let's just focus on next week... which should allow us to see our 1571 area I believe. Possible it takes all week to get up to there and then maybe they "pop it and drop it" on Monday the 11th?
I don't know the date or the exact level that they will hit but that's my target price and the date is anyone's guess? Since I think Tuesday (tomorrow) we'll pop up and drop back for the backtest around 1520-1522 spx then that leaves Wednesday for the breakout over the 1530.94 prior high. Then it's just a race to 1571 in a wave 3 (inside this final 5th wave) which should stop around 1560-1565, then drop back for a wave 4 and then one more move up to just shy of the all time high of 1574 by Monday. Sounds like a good plan... but odd's of me calling this exactly right are slim, so just focus on looking for some short around that double top area seems like the best play too me.
Red
P.S. Keep your eyes open for FP's as I haven't seen any in quite awhile now.
P.S.S.S. New update will be out in a few days on the Penny Stock, but HUGE things are coming and those that own it will be very, very happy in the near future.

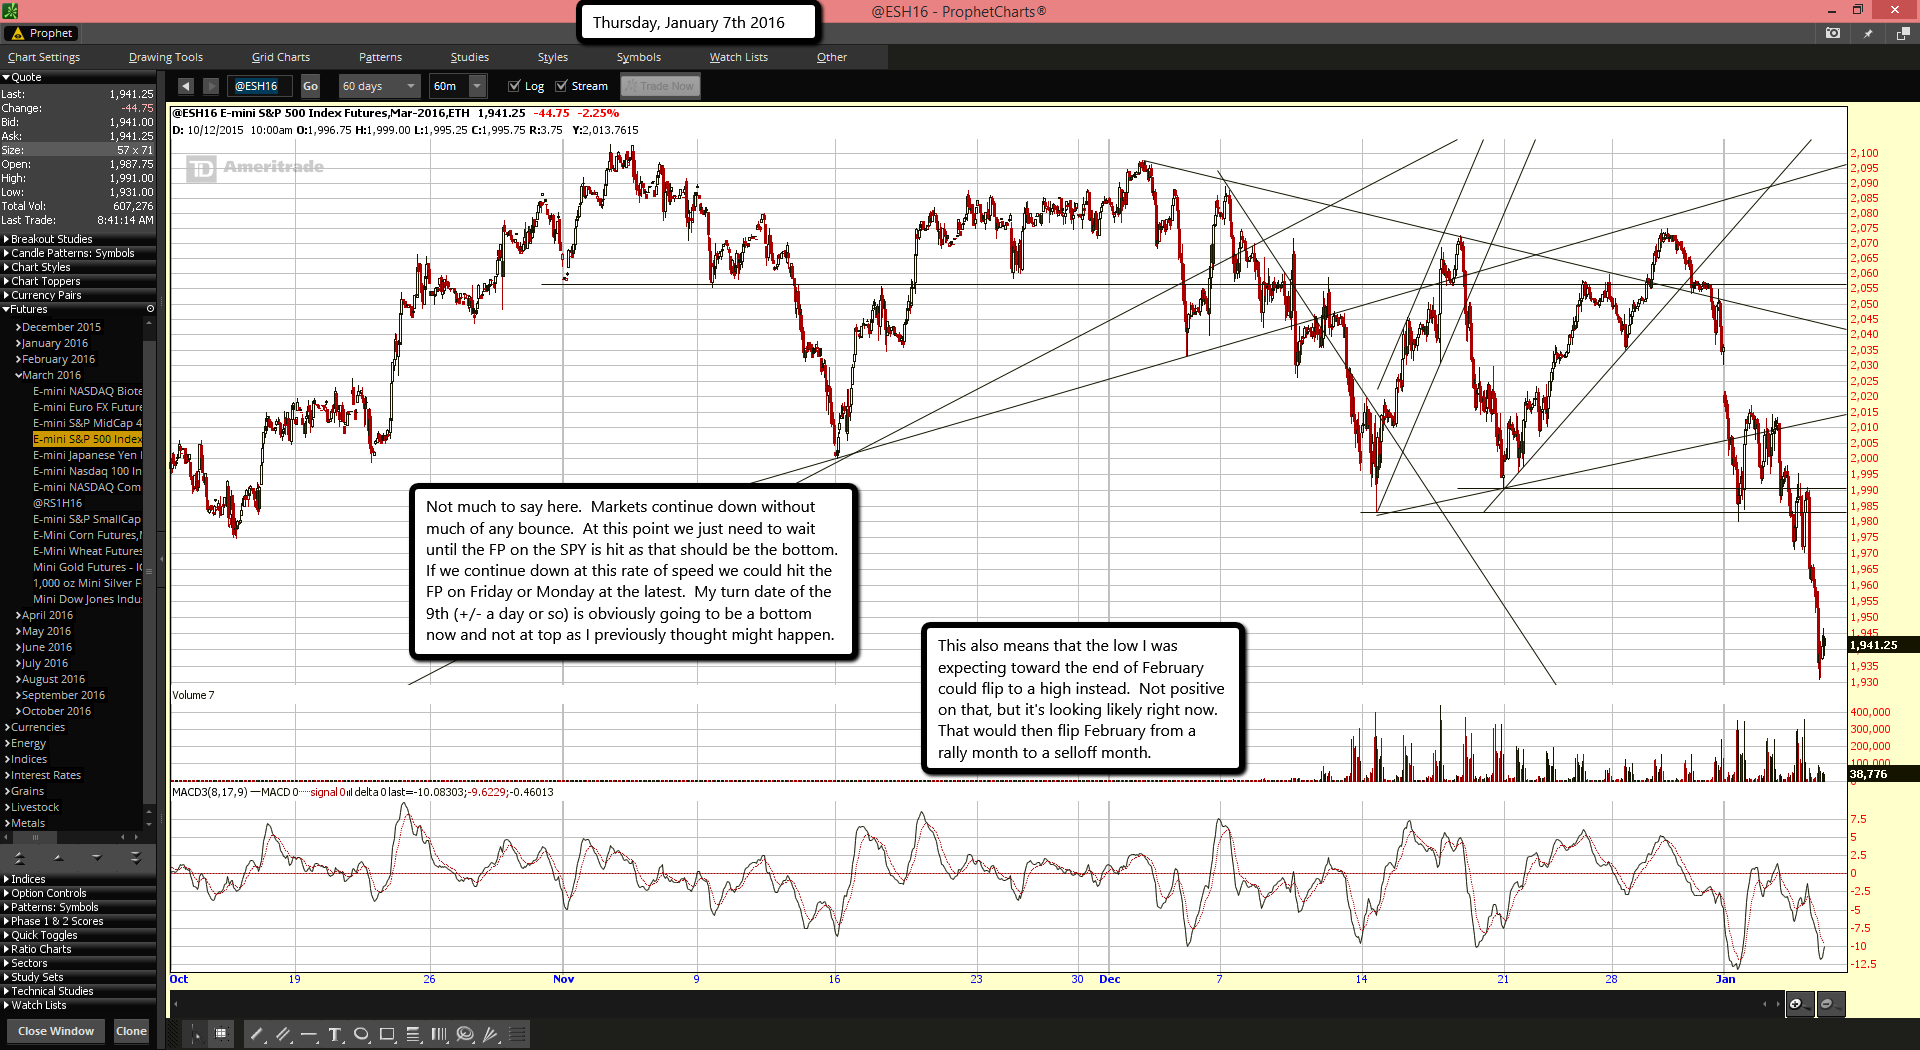 Not much to say here. Markets continue down without much of any bounce. At this point we just need to wait until the FP on the SPY is hit as that should be the bottom. If we continue down at this rate of speed we could hit the FP on Friday or Monday at the latest. My turn date of the 9th (+/- a day or so) is obviously going to be a bottom now and not at top as I previously thought might happen.
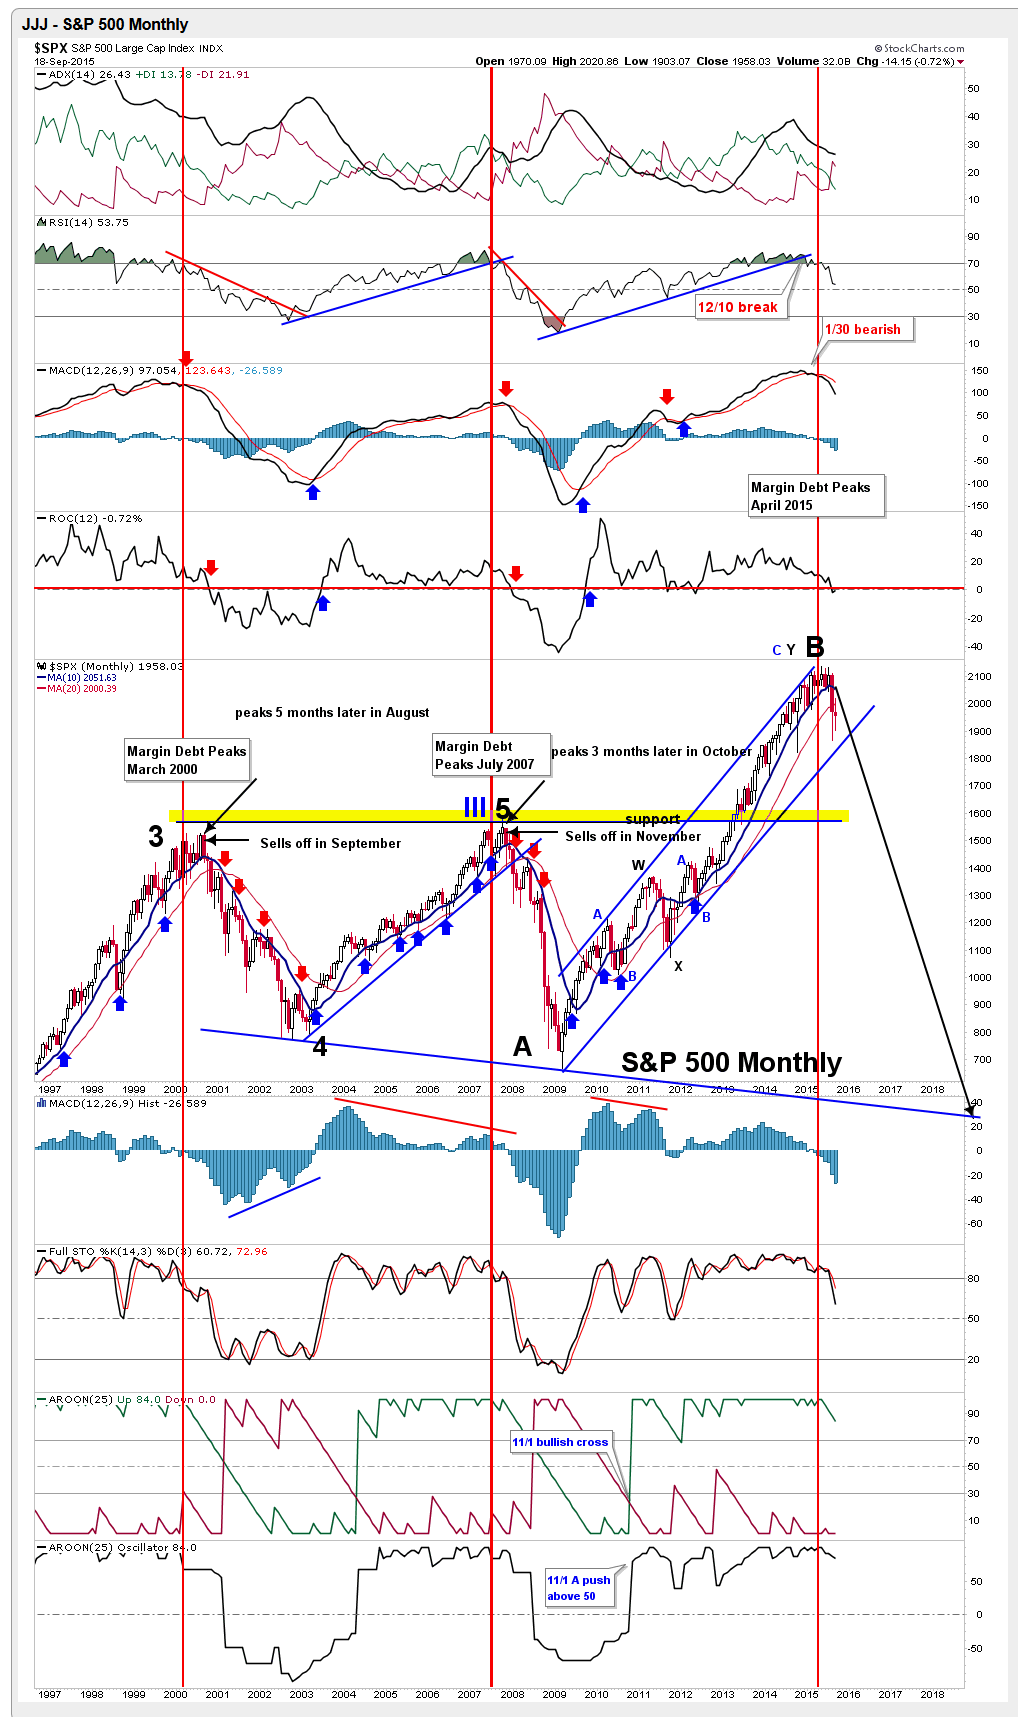


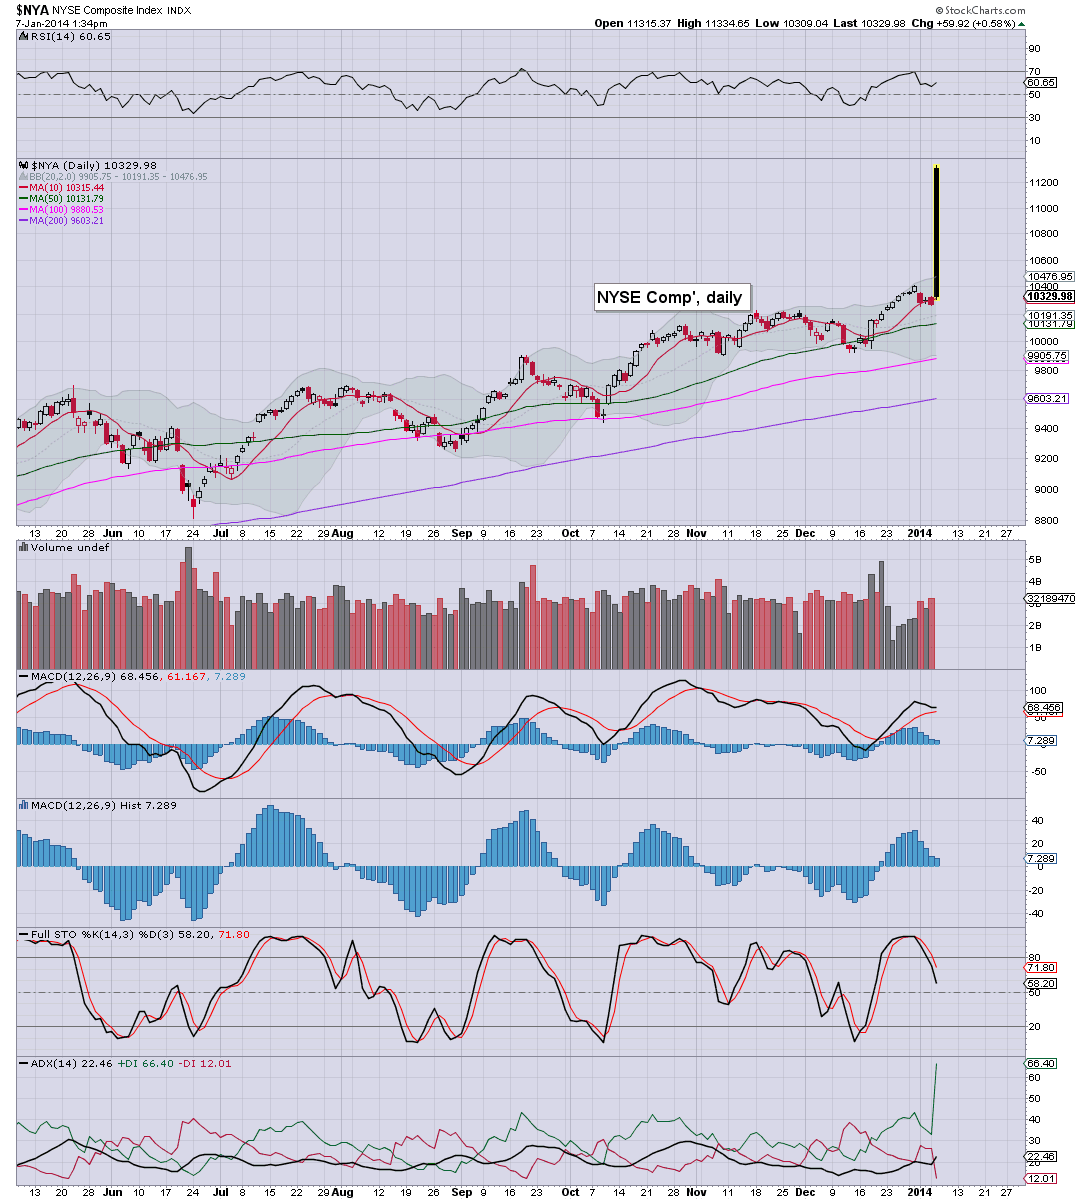
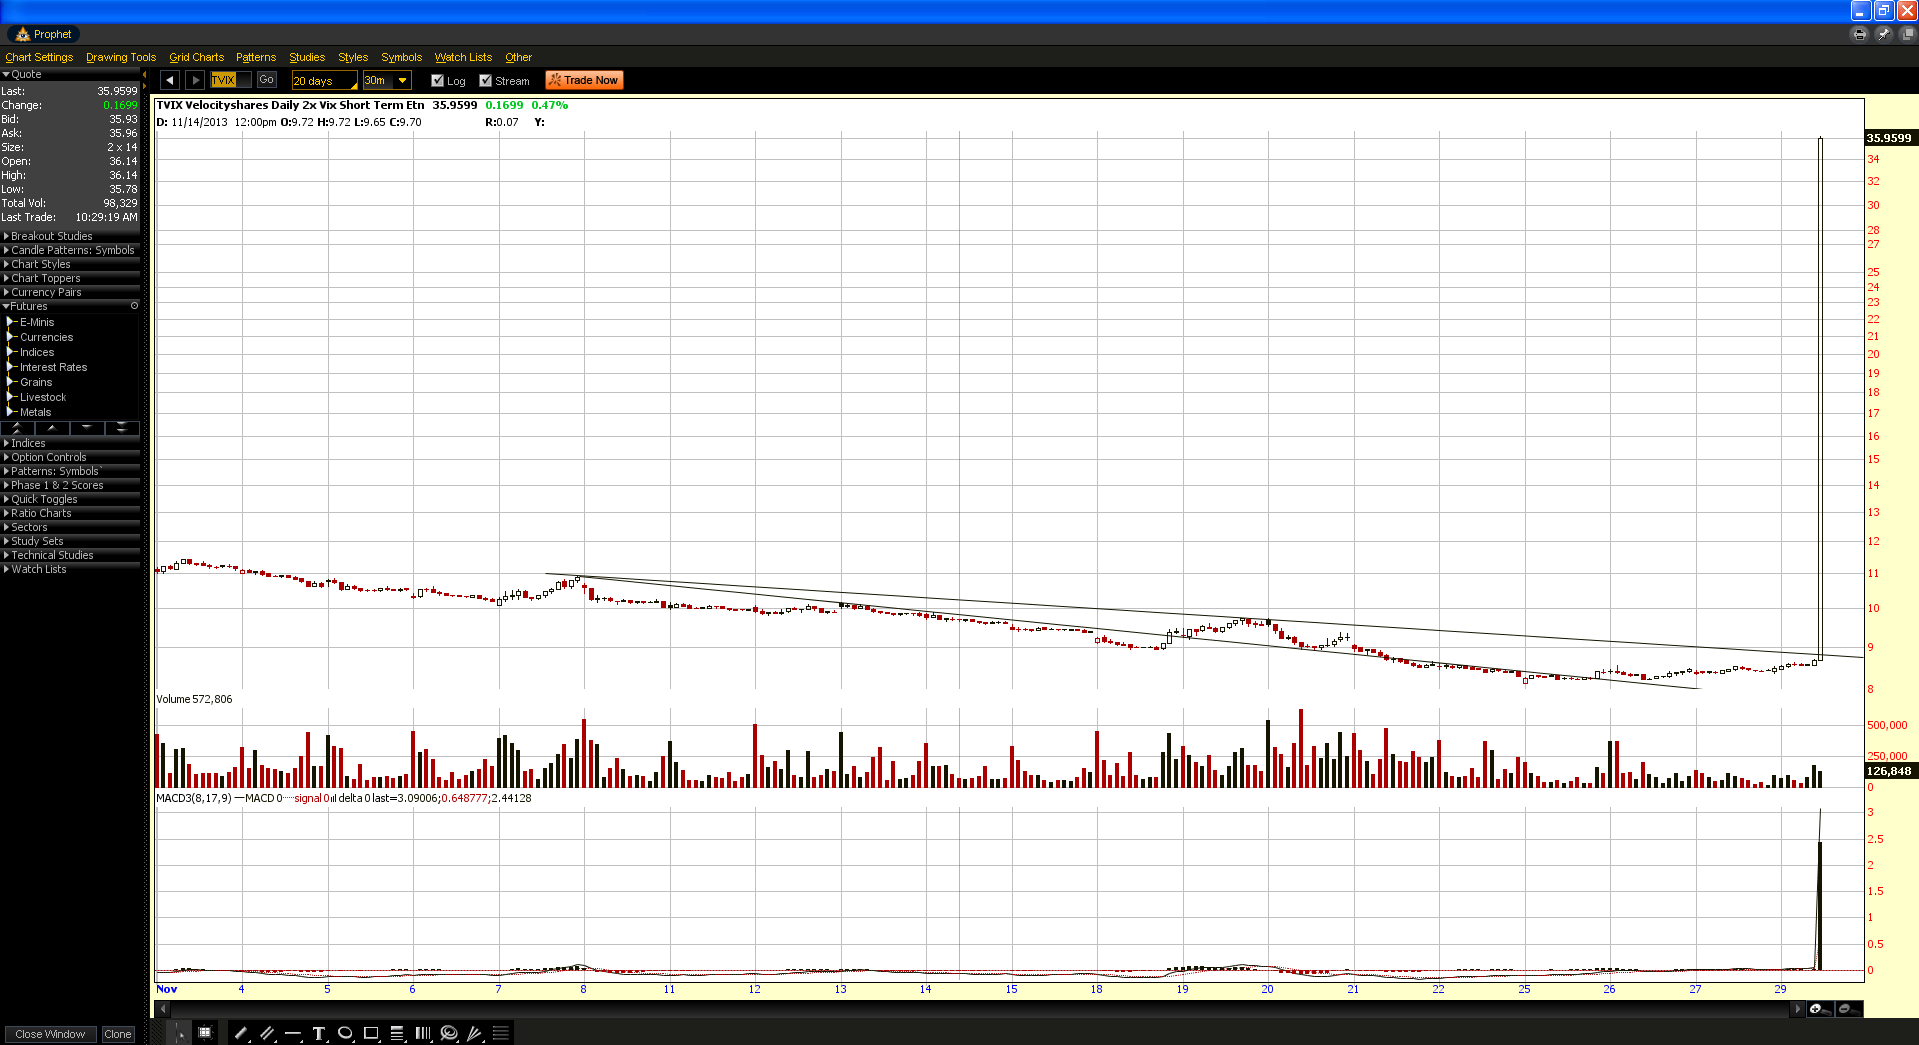
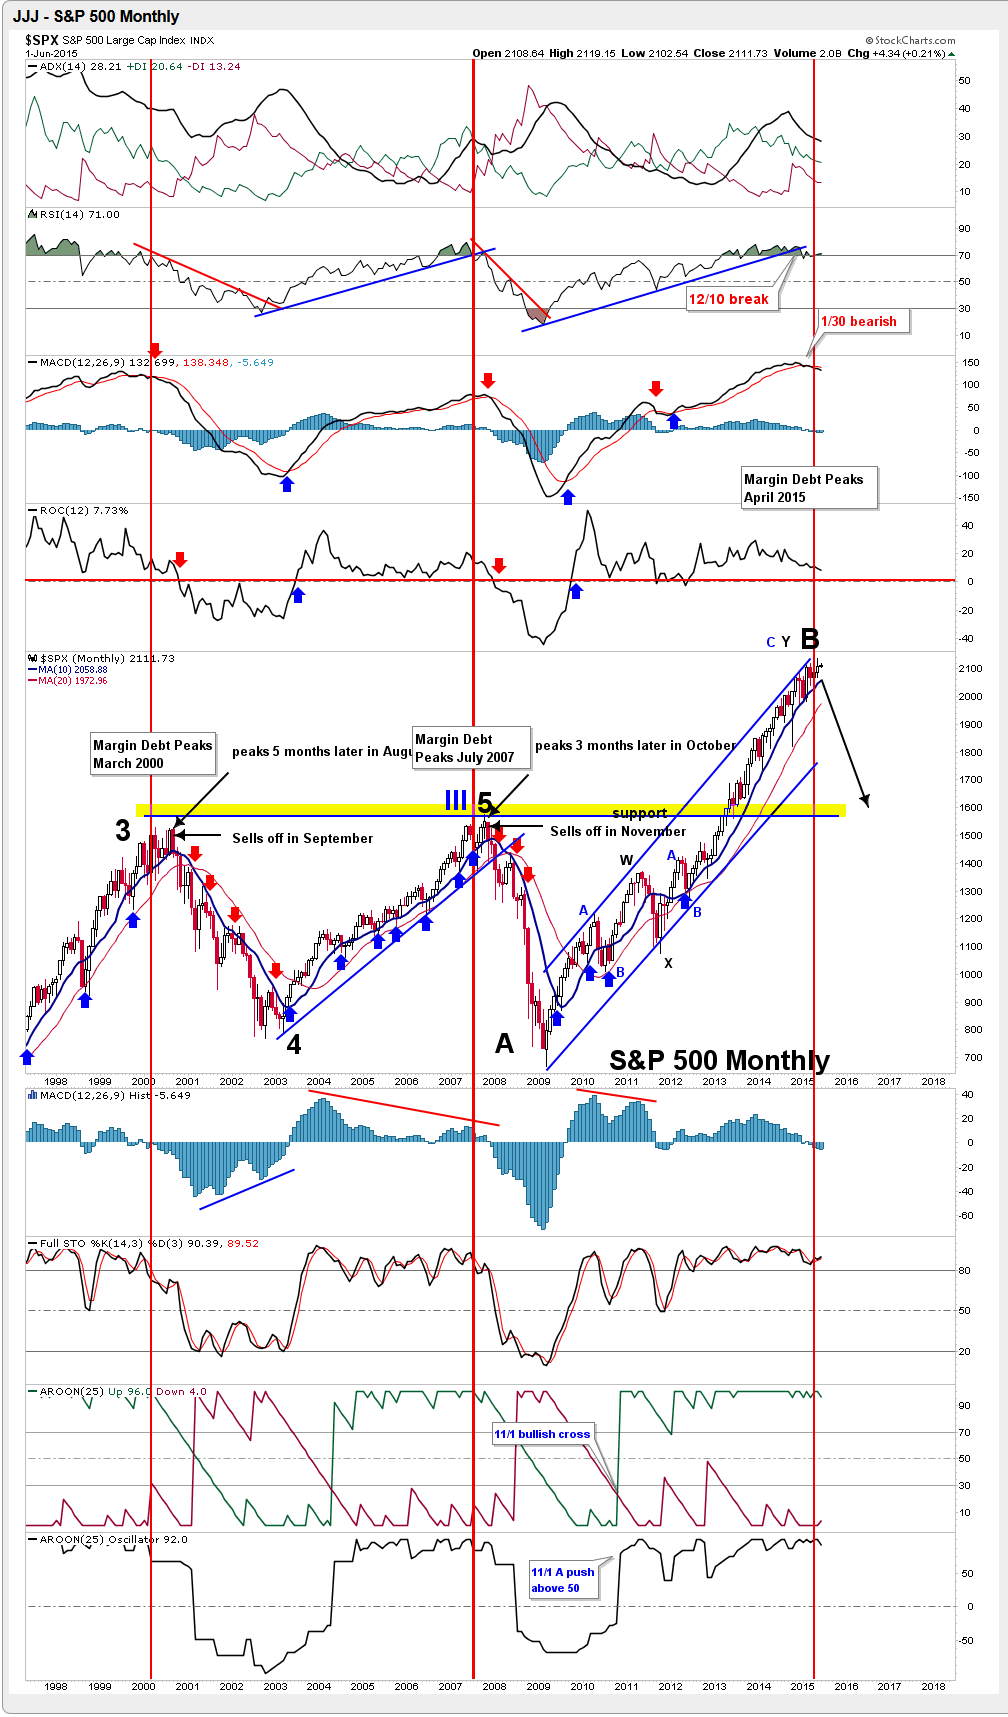
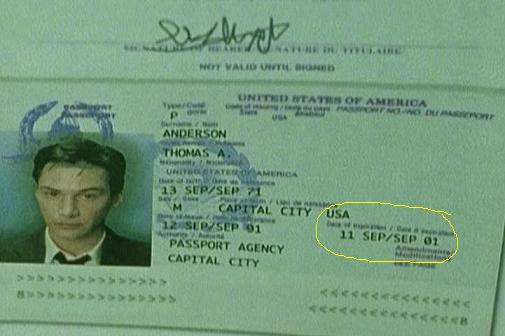
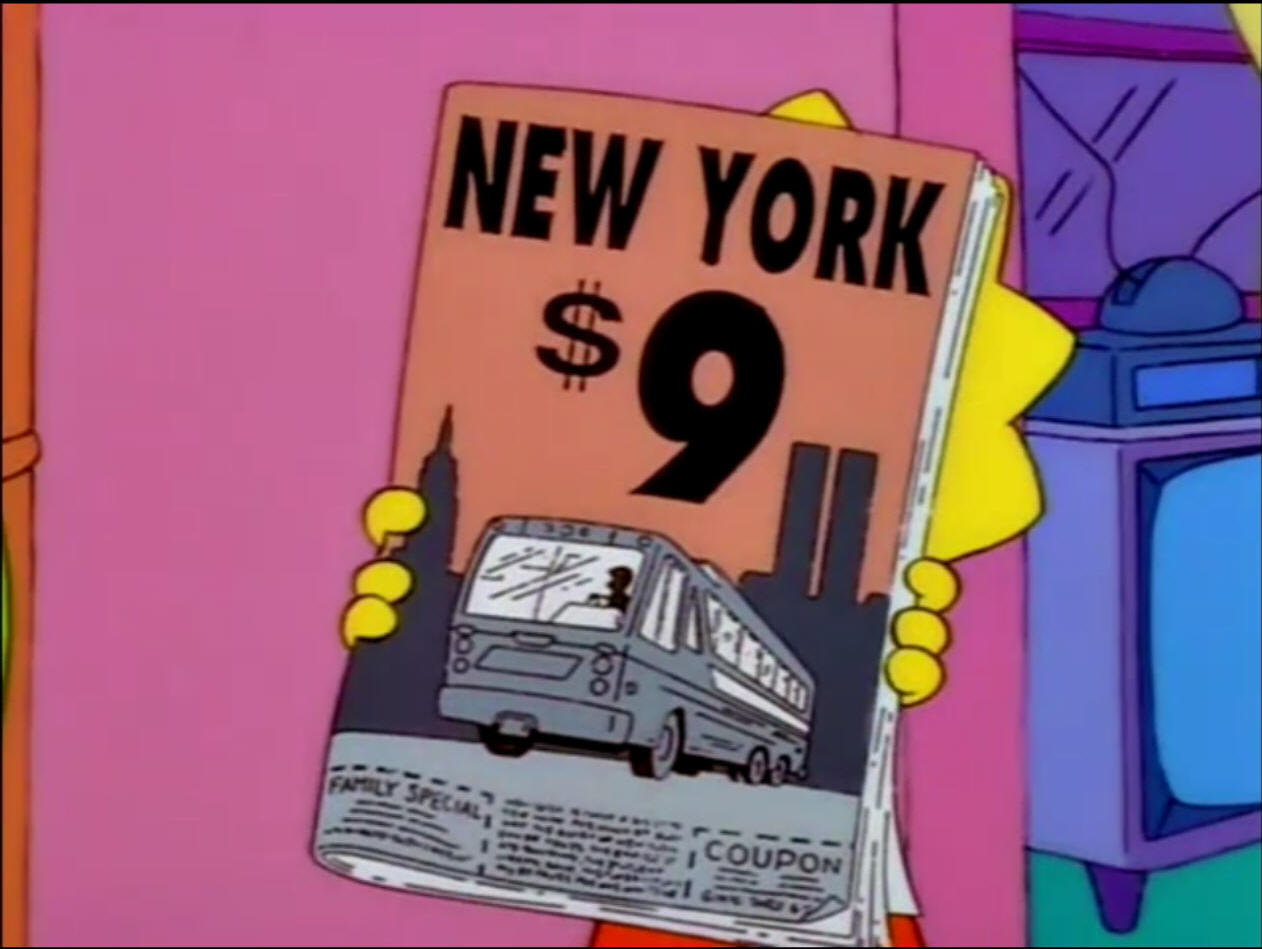


 Chad Gassaway, CMT